
The 2012 figures on U.S. solar installations have just come in, and things are looking, well, sunny. The U.S. Solar Market Insight 2012 report shows that annual solar installations grew 76 percent last year. That growth has been driven by a dynamic and exciting interplay between costs, markets, and policies that have created incentives, knocked down barriers, and brought in all kinds of new customers.
 This post is part of a series on Ramping Up Renewables: Clean Energy Policies to Watch in 2013.
Subscribe to the series RSS feed.
Data Worthy of Diving
The report, from GTM Research and the Solar Energy Industries Association (SEIA), points out that the 2012 growth has taken both solar photovoltaics (PV) and concentrating solar power (CSP) to notable new heights. By year’s end, the 3,313 new megawatts meant that the U.S. had 7,221 megawatts of PV and 546 megawatts of CSP online, enough to meet the energy needs of some 1.2 million homes.
The report offers all sorts of other tasty tidbits, such as:
- 12 states installed more than 50 megawatts last year, compared with eight the year before.
- California became the first state to install more than 1,000 megawatts in a single year.
- The year’s total came from more than 90,000 solar installations — 83,000 of those in the residential market.
- The “non-residential segment” — commercial, governmental, and non-profit systems — accounted for more than 1,000 megawatts of the capacity installed in 2012.
- Over half (54%) of the new megawatts came in the form of utility systems, more than 150 of them.
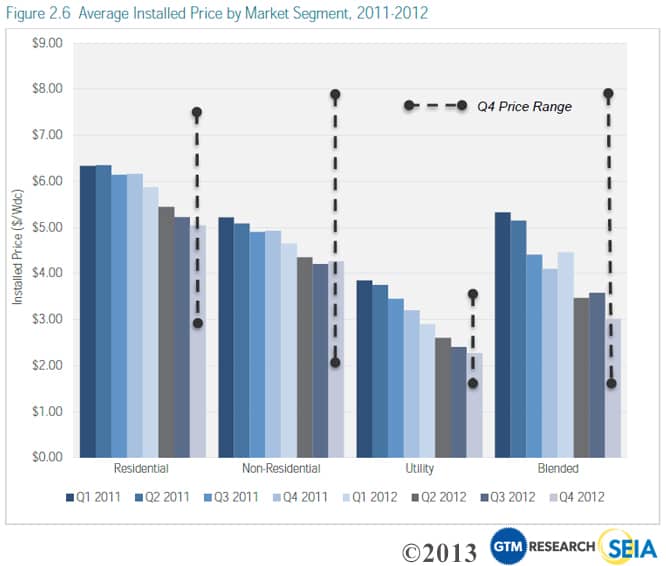
The report also has cost trend data that offers great news for customers of all stripes, as shown in the graphic at right from the new report.
On the home front, the report notes:
The residential market saw meaningful growth in California, Arizona, Hawaii, Massachusetts, and New York, as average residential system prices dropped nearly 20 percent in one year — from $6.16 per watt in Q4 2011 to $5.04 per watt in Q4 2012.
Ten States to Beat, and a Couple of Reasons Why
The GTM/SEIA research also offers an informative (and inspiring) Top 10 list of the states hosting the most new solar in 2012. The list includes sun-drenched states such as California, Arizona, Colorado, Texas, Nevada, and Hawaii, but also New Jersey, North Carolina, Maryland, and Massachusetts.
 So what’s driving the leaders? In California, it’s the California Solar Initiative and the broader Go Solar California effort, which are aiming to help Californians install 3,000 megawatts of solar by 2016. That push is in addition to the state’s nation-leading renewable electricity standard, which is driving development of renewables, including large-scale solar, in California and neighboring states.
At number 6 on the top 10 list, Massachusetts is particularly noteworthy — and I’m not just calling it out because of where I hang my hat these days. The Bay State, the northernmost entry on the list, also models the power of productive policy, even in a state not known for its abundance of sunshine (though it’s always beautiful here). It’s on the list because of the state’s strong commitment to solar, to taking advantage of the state’s history of innovation and grabbing hold of the economic opportunities solar represents.

Always sunny in Massachusetts (Credit: J. Rogers)
A big driver in Massachusetts is the state’s solar carve-out. The state is actually one of 16 (plus D.C.) that include solar carve-outs or multipliers for distributed generation (smaller systems closer to customers) in their renewable electricity standards. What do these terms mean? The DSIRE website explains:
A credit multiplier for solar offers “extra credit” toward compliance for energy derived from solar resources. Solar carve-outs, which are more common than credit multipliers, require that a certain percentage of the [renewable electricity standard] be met specifically with solar energy.
SEIA suggests that carve-outs for solar are important because most renewable electricity standards “tend to favor lower cost renewable technologies, and these programs provide incentives for the deployment of more costly technologies.”
What Next?
In 2013, the interplay between costs and policies and markets that has driven the successes in California, Massachusetts, and elsewhere will continue. The GTM/SEIA report predicts the market will keep growing, though at a more moderate pace than the sector’s stunning 82 percent annual growth rate from 2009 to 2012.
Just how right that prediction is will depend not just on cost trends and other market factors. It will also depend on the policies that stay in place or get strengthened — or weakened — and in how the market and customers respond. Solar’s a field well worth watching, in any case.