
With their tall towers and graceful kinetic ways (read: moving parts), wind turbines aren’t hard to spot if you’re near them. If you want to see the big picture, though, and how your local specimens fit within the national panorama for this exciting technology, a new map tool from the Interior Department’s U.S. Geological Survey makes that easy as pie. Here are the What, Why, and Whee.
What – The USGS WindFarm interactive web map shows the locations of the more than 47,000 wind turbines installed in the U.S. as of mid-2013. WindFarm and the data behind it cover all 50 states.

A screenshot from USGS WindFarm – 47,000 wind turbines, and counting
Why – The USGS pulled together the data because of the lack of any “publicly available national-level data set of wind turbines,” and the importance of good information for good decision making:
Knowing the location of individual turbines, as well as information such as the make, model, height, area of the turbine blades, and capacity creates new opportunities for research, and important information for land and resource management. For example, turbine-level data will improve scientists’ ability to study wildlife collisions, the wakes causes by wind turbines, the interaction between wind turbines and ground based radar, and how wind energy facilities overlap with migratory flyways.
Whee – The new mapping tool is really easy to use, even for those of us who think that Google Earth is some patented new dirt. It offers simple search capabilities, good visuals, and, with just one more click, the make/model/height/etc. technical specs. There’s even a handy video tutorial.

A wind farm in central Washington State, with turbines color-coded by size.
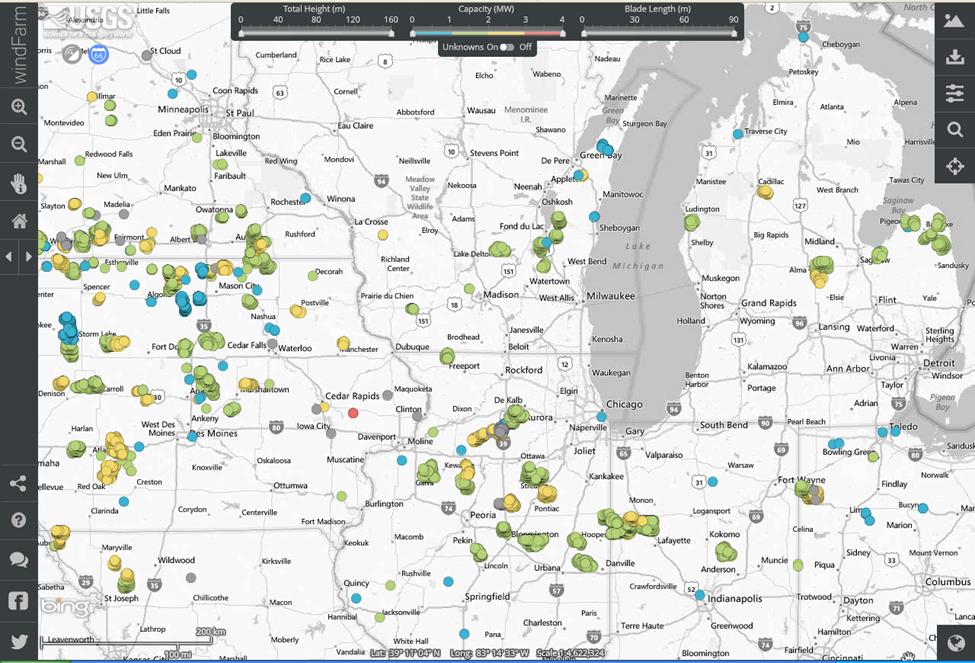
A 100,000-foot glimpse of the transformation underway in the Midwest.
Reviews have called WindFarm “awesome” and “a game-changer for renewable energy.” I’d call it a welcome new tool in our understanding-energy toolbox. A mass of information, an easy-to-use interface, a few clicks, and you can feel smarter already about the energy transformation underway across the country.