
Like most of you, I’ve spent the last few days staring at maps. And now that the issue of red and blue states is settled (mostly) for the next few years, I’m turning my attention back to the maps that will have ramifications well beyond the next election. These maps also contain red and blue, but here red indicates evacuation zones or destruction in the wake of Hurricane Sandy and blue marks the extent of storm surge and the slow steady drumbeat of sea level rise.

This post is part of a series on Hurricane Sandy: Confronting the Realities of Climate Change.
Eye in the sky
The most informative and dramatic maps I’ve found come from the National Oceanographic and Atmospheric Administration’s National Geodetic Survey (NOAA NGS).
The NGS took high-resolution low-altitude photos of the coastal regions affected by Hurricane Sandy and overlaid them on top of a Google map interface. What emerges is a fascinating and sobering overview of the extent of the damage and the scale of the recovery ahead. The site also offers property owners and displaced residents an opportunity to assess the damage to their homes and communities from afar.
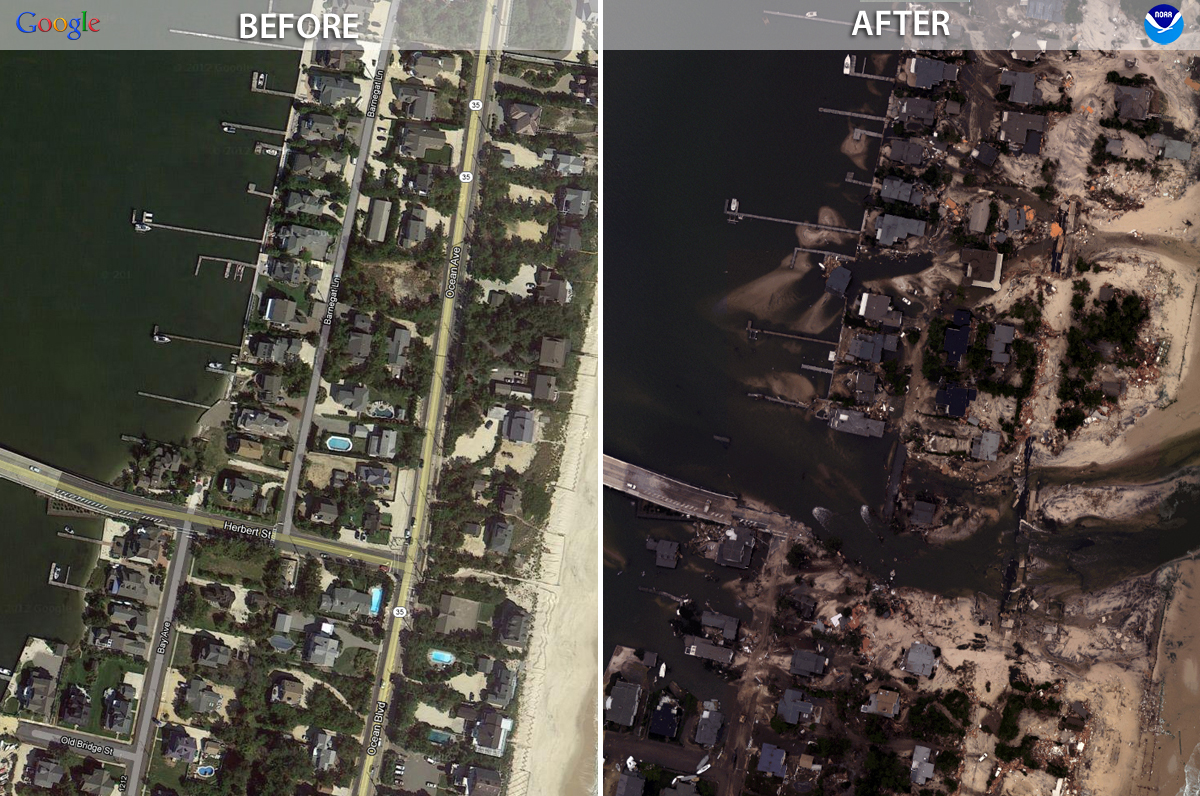
Images of Mantoloking, New Jersey before and after Hurricane Sandy (NOAA 2012). Visit the NOAA website for more pictures.
An even more dramatic picture of the destruction can be seen on another NGS site. This site takes photos of the heavily damaged areas and couples them with Google maps satellite images of the same region before the storm. The viewer can seamlessly swipe between the two and see the contrast between life before the storm and current reality.
Welcome to Yugoslavia: The risks of relying on old, outdated maps
The dynamic and up-to-date nature of these maps highlight a limitation of most maps we use, which is, they are static. Maps capture what the world looks like at the time they are drawn, but as Sandy and many climate change models have shown, the world is not a static place. Using yesterday’s maps to make decisions for our future is like using an atlas from 1986 to plan your next European vacation (“Ooo, Yugoslavia, that place sounds fascinating”).
Yet the government is making investments based on maps that are just as outdated
The Federal Emergency Management Agency (FEMA) flood insurance maps, which are used to make important investment and development decisions in low-lying areas, date from the 1980s. The maps are currently being redrawn, but the agency is still relying on historical data to update the maps and is, as of yet, not taking future climate scenarios into account.
The shortcomings of using this outdated data can be seen in a series of maps of the Boston area from the 2007 Northeast Climate Impacts Assessment. The maps show the difference in the current 100-year flood maps (hatched darker blue) for downtown Boston (top), Back Bay (center), and South Boston (bottom), with what a projected 100-year flood map would look like in 2100 based on a high-emissions climate scenario (light blue).


Maps are powerful tools. We use them constantly to find the nearest supermarket, or plan a route to work, or even to predict presidential election results. But they are only useful as long as they describe reality. The reality is that our climate is changing, our oceans are rising, and our coastlines are receding. Our maps — and our policies — must also change to address this new reality.