
Nuclear Energy Activist Toolkit #40
The 2014 edition of the annual World Nuclear Industry Status Report was released in July. Mycle Schneider and Antony Froggatt authored this report with contributions by Yurika Ayukawa, Shaun Burnie, Raffaele Piria, Steve Thomas, and Julie Hazeman. Labeling it a report is somewhat misleading. It’s more like an encyclopedia filled with facts and insights.
Schneider, Froggatt and their associates compile and present scads of information. For example, Figure 1 from their report (below) shows the annual amount of electricity generated by nuclear power reactors worldwide from 1990 to date along with the percentage of total electricity generation. The data show that nuclear power’s percentage of overall electricity generation has dropped over 38% from its peak of 17.6% in 1996. Last year, nuclear power reactors produced only 10.8% of the electricity generated worldwide. Two decades of steadily declining generation percentage contradicts the notion of a “nuclear renaissance.”

Click to enlarge (Source: Mycle Schneider Consulting)
If it only provided one-stop shopping for facts and figures about nuclear power worldwide, the report would be invaluable. It saves readers the effort needed to find and fetch this information from a wide array of source materials (i.e., the unenviable task undertaken by the authors in developing the report). But the report goes far beyond merely reporting nuclear numbers and illustrating their trends. It answers many of the associated “why” questions.
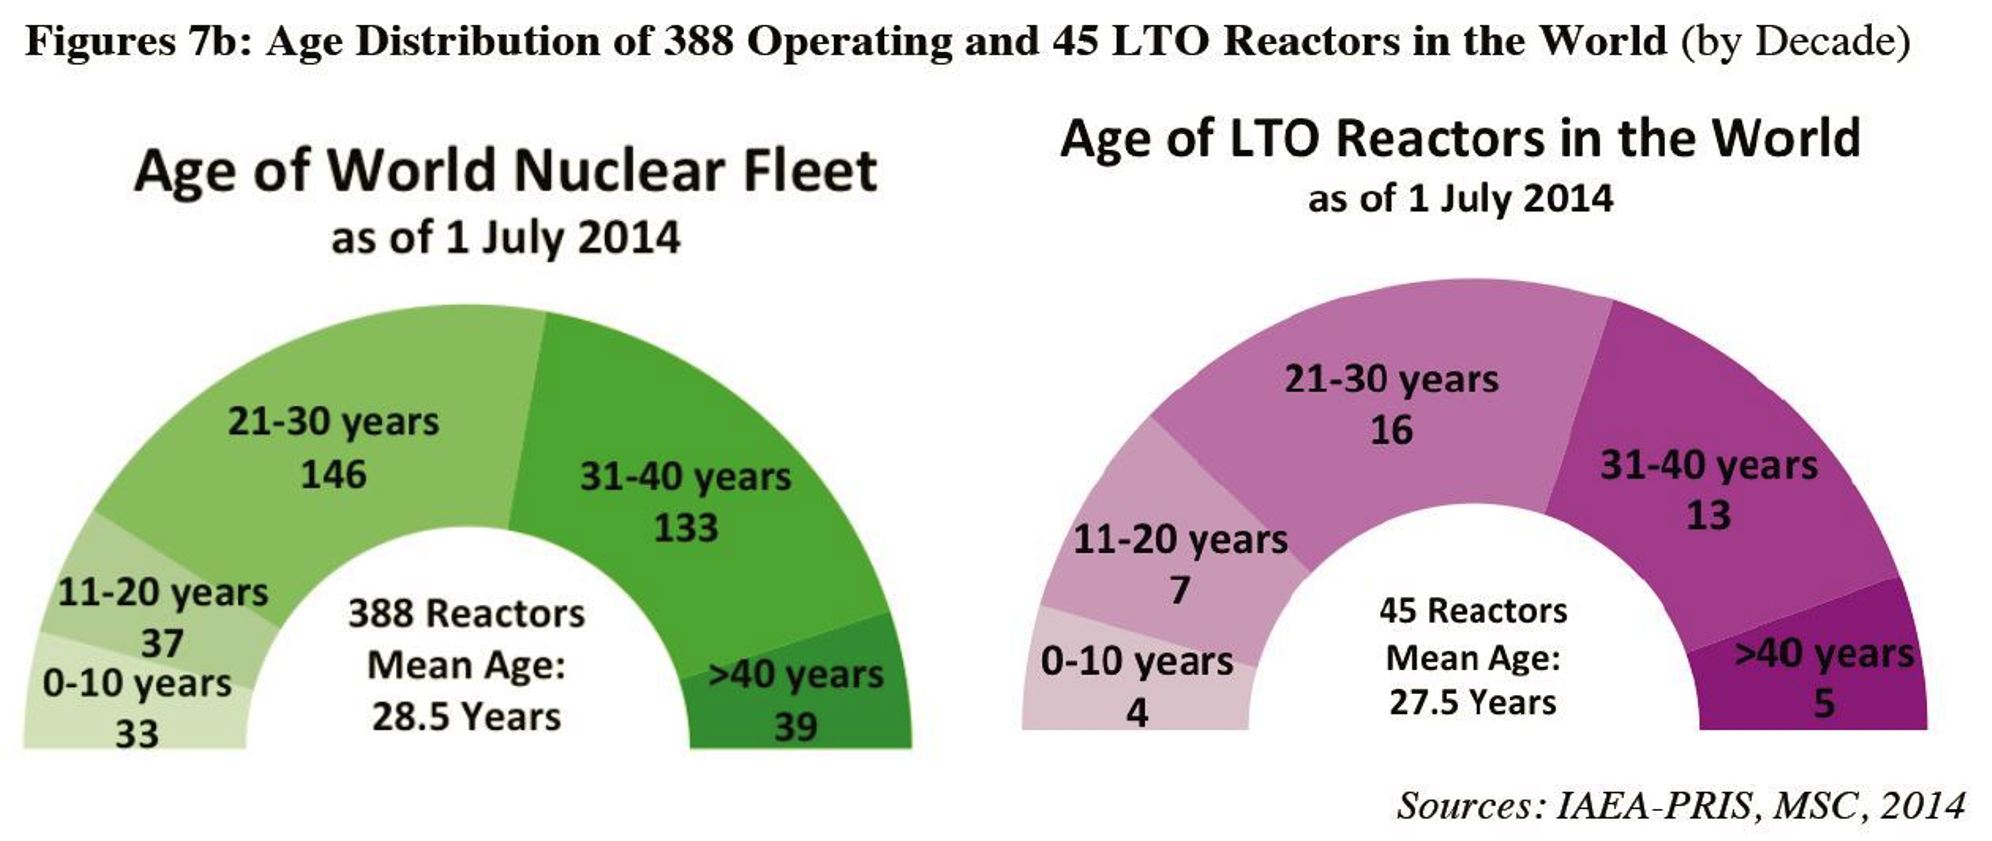
For example, Figure 7a from the report (below) shows the age of the 388 nuclear power reactors operating on July 1, 2014, along with their mean age of 28.5 years. This information is available online at websites like that of the International Atomic Energy Agency. Schneider, Froggatt and their associates probe a little deeper. This year, they introduced a category termed Long-Term Outage (LTO) for reactors that have not been permanently shut down but which did not operate at all during 2013 and during the first half of 2014. Forty-five reactors fell into this LTO bin.

Click to enlarge (Source: Mycle Schneider Consulting)
Figure 7b from their report (below) revealed that the age profile of the 45 reactors in long-term outages was not significantly different from the profile of the 388 reactors in operation. In other words, the factors causing the long-term reactors were not age-biased. The report is filled with many such nuclear nuances, providing the back story for the numbers and trends.
Click to enlarge (Source: Mycle Schneider Consulting)
The report contains extensive commentaries on economics of nuclear power and its alternatives and about nuclear plant construction timelines.
Bottom Line
If you only have time to review two annual nuclear reports, the World Nuclear Industry Status Report should be among them. (The other, of course, would be UCS’s annual report on the NRC and nuclear power plant safety.)
What I personally like most about the annual World Nuclear Industry Status Reports is getting to refer to their extensive information without having to do the extensive homework necessary to compile and package it. They are essentially the Cliffs Notes for nuclear power worldwide.
The UCS Nuclear Energy Activist Toolkit (NEAT) is a series of post intended to help citizens understand nuclear technology and the Nuclear Regulatory Commission’s processes for overseeing nuclear plant safety.