
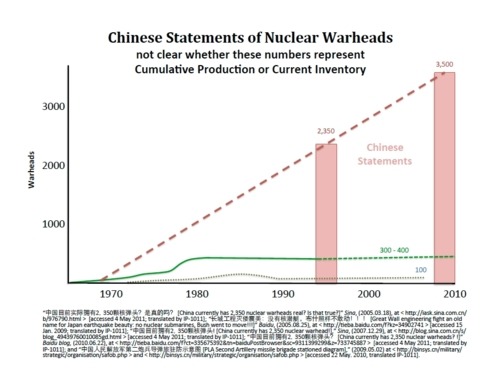
On September 26, at an event in Georgetown sponsored by the Nonproliferation Policy Education Center, Georgetown University Professor Phillip Karber presented a report containing this graph depicting the possible size of China’s nuclear arsenal.
Tomorrow (Dec. 7), Prof. Karber will apparently present a different graph on the size of China’s nuclear arsenal in his talk at the Elliot School of International Affairs.
Here is the new graph.
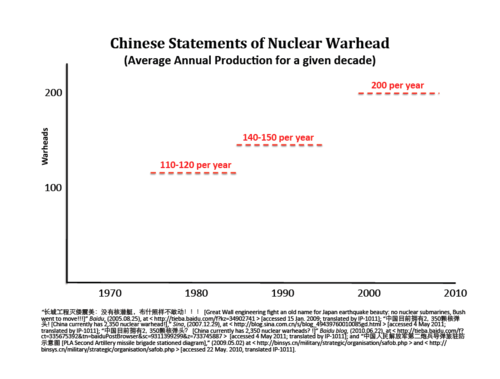
This graph instead gives estimates of the number of warheads China reportedly produced annually over several different time periods.
An important question is what “Chinese statements” these numbers are based on.
The sources listed under the new graph are the same collection of personal blog posts from Chinese individuals listed under the earlier graph, with one exception: a blog post under the old graph was removed (more on that below). Unfortunately, by listing these sources under the graph Prof. Karber presents them as authoritative statements on the size of China’s nuclear arsenal. But let’s look at these sources.
As I explained in an earlier post, the sources listed are personal blog posts that do not make claims about the size of China’s arsenal or its warhead production rate, but instead quote numbers the bloggers have seen on the web and question whether the numbers are correct — the posts are not saying these numbers are accurate. A more appropriate title for the graph would be “Chinese Questions about Nuclear Warheads.”
Inexplicably, Prof. Karber does not cite the original source of the numbers the bloggers are questioning. That was a Hong Kong magazine called The Trend, which published in its September 1995 issue the 2,350 figure shown in the initial graph above. I made a copy of that article available for download here and am finishing a careful translation of it that I will post on Wednesday.
That same Trend article published the annual production rates of 110-120 and 140-150 shown in the second graph. Again, it is unclear why Prof. Karber does not cite the original article.
But none of the sources listed, nor the original Trend article, give the 200 per year number listed in the second graph. That is a spectacular claim—what is the source?
Finally, what about the source that was removed from the second graph?
Interestingly that was the only one of the sources from the original graph that cited an even earlier source—from 1986—published in a British journal by a US researcher, which appears to be the original source of the speculation in the Trend about the Chinese arsenal size.
That story will follow in a subsequent post.