

Image courtesy of Flickr, Carol Schaffer.
Zootopia is a place where mammalian species, both predators and vegetarians, co-exist in harmony, and a female bunny overcomes prejudice to become a crime-fighting cop. We can pick up this message of diversity and inclusion and apply it to one of the challenges we have with new energy technology.
One of many changes in our energy picture is a much-debated graph of the power demand net of solar energy, known as the “Duck” curve. In it, the midday supply of solar energy pushes down the curve, making the belly, while the upward evening slope of demand as the sun sets makes the neck.
The duck curve reminds us that solar energy is plentiful in the daytime, but that situation changes with sunset.

The Duck Curve: controversial symbol of change. Credit: California ISO and J. Lazar.
At the Union of Concerned Scientists, we see this as an opportunity to provide low-cost energy while the sun is shining, and shift some appliance energy demand to mid-day.
For many in the utility industry, though, this new shape represents a new, possibly frightening challenge, requiring new, unbiased thinking.

Nene, the Hawaiian state bird, is endangered. Credit: U.S. Fish and Wildlife Service
But as Zootopia reminds us, fear and bias do not solve problems. While the duck has been a focus of attention in California, on a per-capita basis there has been more solar energy added in Hawaii. This, plus the fact that each of the Hawaiian islands has a separate grid, means that utilities in Hawaii are learning to deal with a curve that rises more steeply than the California duck.
The Hawaiian utilities are already familiar with a shape that should be named after the state bird, the ne’ne curve.
As the rise of solar is not just a California or U.S. phenomena, we should prepare for a Zootopia of curves, and power grid adaptations that can co-exist with the changing energy supply.
While the curve appears first in lands that are drenched in renewable energy, we must credit Germany for leading the way.

A familiar symbol for a new concept. Photo: petguide.com
Germany is now producing 20 percent of its annual electricity from wind and solar, and faces what we might call a Dachshund curve. See a discussion with a German grid operator where he describes how a change in thinking allowed sections of Germany to be powered by over 40 percent wind and solar each year.
Another region that first learned to adapt to variable renewable energy from managing wind is the U.S. Pacific Northwest. A network of majestic rivers and publicly owned dams contributes to the situation, which I call the salmon curve. This region typically has a bulge in its power supply in the spring season when the wind blows at the same time the rivers are driving hydroelectric power onto the electric grid.


Symbolic horse running free. Credit: freedesignfile.com
Texas, already home to more wind power than any state, will soon have a lot of solar energy on its grid. Consider calling this the running horse curve?
The grid operator in Texas has demonstrated considerable skill in managing what some might actually consider a bucking bronco.

Wind across Texas and Plains, 1 hour before sunrise, 10 April 2013. Credit: HINT FM.
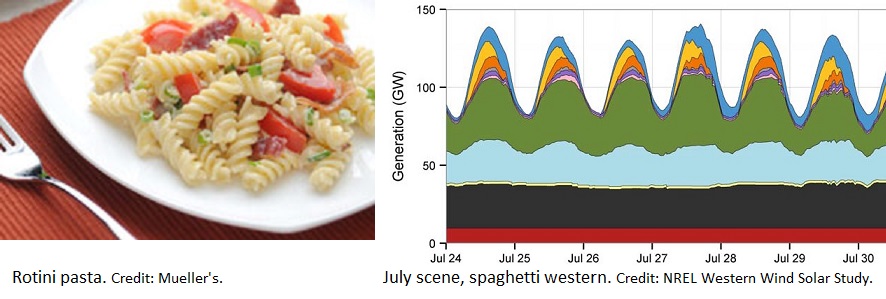
As utilities become more familiar with the daily pattern, the role of so-called baseload plants becomes less relevant. Consider these images of the rotini curve in Italy.
Will we ever see in China the Peking duck curve?
Seriously, the grid of the future is already here. The arrival of abundant solar and wind means the flexibility and adaptation in the old generating plants are as important as the energy they produce. More sources of flexibility are available, when we value diverse resources, as detailed in a great work by the Regulatory Assistance Project, Teaching the Duck to Fly.
Symbolic fast-moving mammal. Photo: Tom Fried/Wikimedia Commons.
Consider running water heaters and charging electric vehicles when renewable energy is abundant. Also, combine wind and solar, and offshore wind, with their diverse production patterns, to make a smoother, flatter energy curve. This is the sort of thing we always have done with electricity generation.
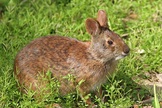
While we haven’t yet claimed the rabbit as a shape for an energy curve, perhaps it is a better symbol than a sloth for the changes we are—and need to be—making to the electricity grid.