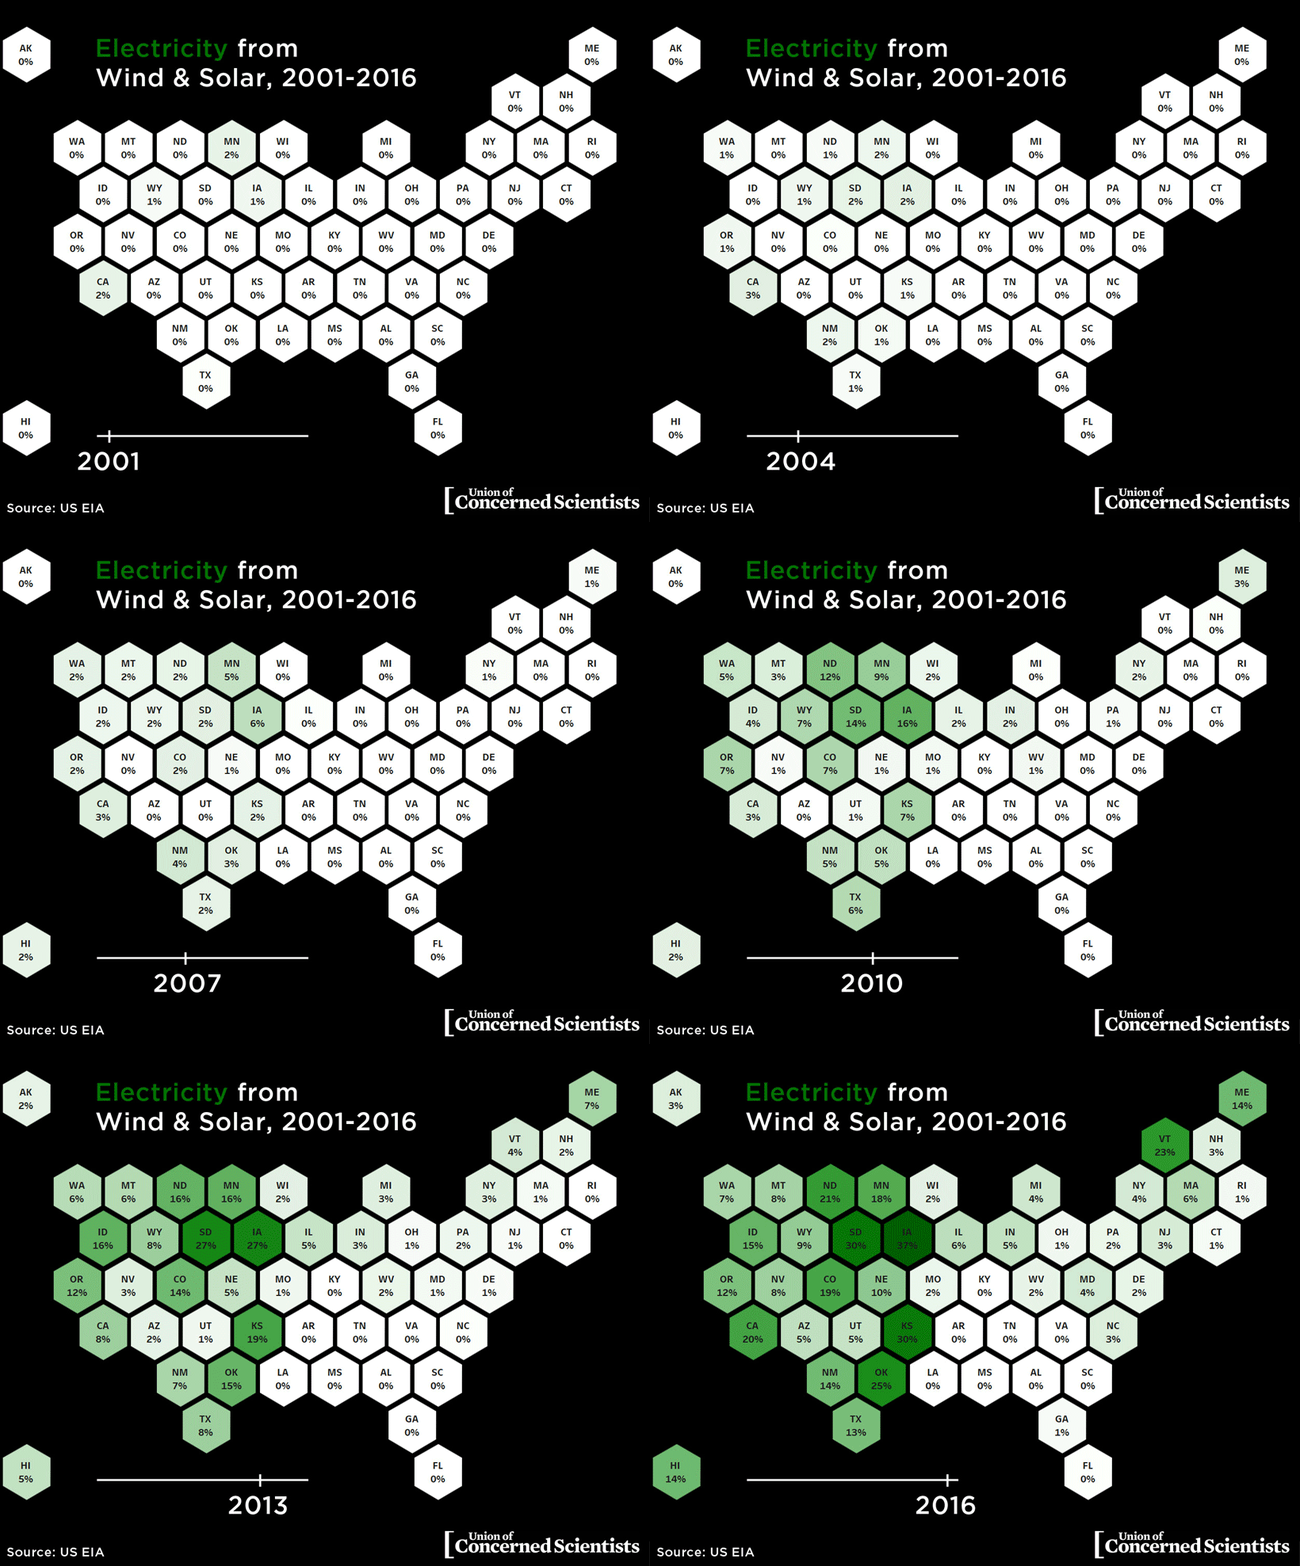
Here at the Union of Concerned Scientists, we spend a lot of time focusing on the future—where we need to get to (on climate change, for example), how we do that (clean energy, clean transportation, carbon pricing,…), what happens when we delay (sea-level rise, anyone?). For clean energy in particular, though, it’s great to remember how far we’ve come and how fast we’re moving. A look at how states’ use of wind and solar has grown does that pretty nicely.
My colleague Shannon Wojcik and I have been digging into some of the numbers from the US Energy Information Administration, a great resource for historical data on America’s energy evolution. Specifically, we’ve focused in on two renewable energy technologies that have made particularly impressive progress in recent years: wind turbines and solar panels.
And here’s what the data show: From tough-to-spot levels in 2001 to impossible-to-ignore ones in 2016, those two technologies alone have made quite a splash.

Here are a few notable tick marks on the wind+solar timeline of progress in the states:
2001 – Not a whole lot o’ color. Only 10 states even show up as having non-zero figures for generation from solar plus wind. And only three of those—California, Minnesota, and Iowa—register above 1%.
2008 – The first green shoots are visible. No state has passed the 10% mark, but four have hit at least 5%.
2009 – Here comes the wind boom. Minnesota is just shy of 10%; Iowa soars past that mark.
2012 – The wind+solar 10% Club is nine members strong, and Iowa and South Dakota have become founding members of the 20% Club. Large-scale solar starts making its presence known.
2014 – EIA figures out that small-scale solar, too, is too important a piece to ignore and starts including those data in its reporting.
2016 – The wind and solar numbers—nationally, at 5.5% for wind and 1.4% for solar—add up to some pretty impressive levels in leading states:
- 16 states are at or above 10% of generation, 6 states are above 20%, and Iowa and South Dakota have passed 30% (with Kansas just inches from that goal line).
- For Iowa, in fact, wind adds up to 37% of generation. To put that in plainer (maybe) language: More than one out of every three electrons generated in the Hawkeye State is (almost magically) conjured out of thin air (sort of).
- For California and Hawaii, sunbeams do even more of the work than wind in 2016. The Aloha State gets 6% of its generation from wind and 8% from solar, while the Golden State’s generation is 7% wind- and 13% sun-fueled.
- Of the 16 members of the 2016 10% Club, half have doubled their solar/wind percentage in just the previous five years.
2017 and beyond
This is the part where it gets even more exciting. Wind finished 2016 with its second strongest quarter ever for new installations, and solar had a big push throughout 2016. Those numbers will show up in the generation percentages for 2017 as a whole.
Installations during 2017 itself are unlikely to be record-setting overall, but they should add solid additional chunks of solar panels and wind turbines that’ll show up in the data next year.
And then? We keep going.
We push to make the dark states darker and to get the pale ones finally in the game. (I’m pretty sure the Sunshine State and its Southeastern brethren could be doing more with solar… or wind.) We make solar, wind, and other renewables count even more by shrinking the denominator with energy efficiency. We make sure we’ve got the right policies for removing barriers to clean energy, letting American businesses create 21st century jobs, and driving energy innovation that’ll take us through the coming decades.
If you need inspiration, just look at the GIF one more time. And imagine what it could look like in 2020 and beyond. Then join us in making your vision a reality.
Big thanks to Shannon Wojcik, a Steven Schneider Sustainable Energy Fellow from Stanford University, for her help in analyzing and presenting this neat data.
