
The “learning curve” is the biggest story in solar power. You can see it in action in the graph below: as the price of solar drops, the number of installations skyrockets. The two are linked—the price decline both causes, and is caused by, the increasing number of solar installations.

Source: Earth Policy Institute/Bloomberg.
A “learning factor” is a measure of how quickly changes like this take place. The learning factor determines the steepness of the learning curve [1]. A factor of 20%, for example, means that, for each cumulative doubling of the product’s sales or installations, the price falls by about 20% (see figure).
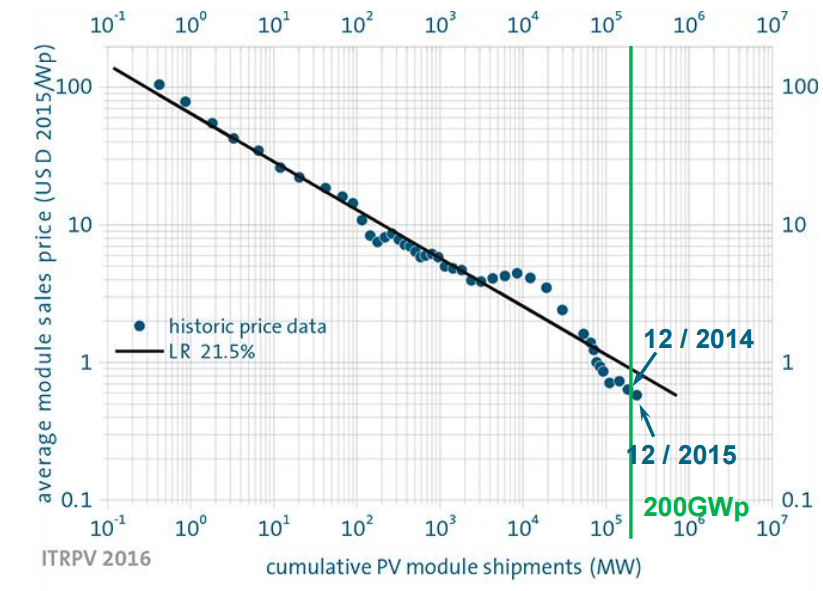
This graph shows a learning factor of 21.5% from 1976 through 2015. Short-term fluctuations are partly due to supply chain issues. Source: International Technology Roadmap for Photovoltaic
How does the learning curve work?
How do sales lead to cost declines? The National Academies recently released a report on clean energy technology innovation. While I don’t endorse all of this report’s conclusions (they lean heavily on EIA’s overly cautious forecasts), I like their classification of the four principal ways in which costs come down over time:
- Research and development. This process is uncertain in its outcomes, often creates significant spillover benefits for other sectors, and may feature long time horizons.
- Learning by doing. This occurs as a byproduct of manufacturing and deployment. Companies develop (generally incremental) improvements to industrial operations, installation procedures, and sales and financing processes.
- Economies of scale. These result from companies or industries getting larger, spreading some relatively fixed costs over a larger volume of product sales. At the industry level, one way in which economies of scale might reduce costs is greater specialization, as companies emerge to focus on one component of the product or supply chain rather than all companies being required to be generalists.
- “Learning by waiting.” This involves harnessing the spillover effects from other industries, technologies, or countries. As the report notes, this is “the result primarily of innovation that occurs elsewhere and not of accelerating technology deployment.”
What does the learning curve do?
What is the benefit of the learning curve? New technologies are first deployed in small and relatively cost-insensitive niches where their performance attributes are valued. The learning effects reduce costs and enable the technology to succeed in a broader range of applications. Increased deployment leads to further cost reductions, which lead to further deployment.
For electric lighting, early niches included theaters and mills, where gaslights were undesirable for safety reasons. For solar power, satellites valued its ability to generate power without combustion. As the technology improved and costs came down, it became successful in more applications, such as off-grid homes.
This pattern is repeated over and over in many types of technologies, as described by Frank Geels among others. The trend is typically an “S-shaped” curve defined by a logistic function (see graphic).

A logistic curve showing a hypothetical trajectory for electric vehicle sales. The market acceleration is seen in the left portion of the curve; eventually, the market approaches saturation and growth slows.
What is the drawback of the learning curve? Complacency. If you know costs are going to fall, why would you buy solar panels now?
Well, for the most part, costs don’t fall just from the passage of time. That fourth item, “learning by waiting,” really depends on somebody else doing the R&D, deployment, and learning by doing. It means being a free rider on the efforts of others.
Solar didn’t become more affordable just because 1980 (or 2008) turned into 2016, but because during that time millions of people around the world installed solar even when it wasn’t the most cost-effective option. And now, in many cases, solar costs less than grid power—thanks to those pioneers who brought the industry to its current state of maturity.
Act now! This offer is good for a limited time!
How should policymakers consider these effects? If “learning by waiting” provides a reason for free riders to delay, but installations now will drive “learning by doing,” they might consider incentives that gradually decline as the market grows.
California utilized such a system, with solar incentives declining when cumulative installation benchmarks were achieved. Germany’s incentives declined at specified points in time. California’s approach had advantages in managing program costs. Remember, the learning curve results from deployment, not from time passing.
And while declining incentives can encourage prompt action, they do not necessarily need to decline to zero. That’s because we still need to consider externalities. If clean energy avoids damages from pollution, then incentives are economically warranted to reflect this fact, even when the technology is mature. (Better still would be internalizing the damages from pollution in the costs of all forms of energy.)
Tesla and learning curves
Tesla has planned to use the principles behind the learning curve to bring down the costs of their electric vehicles (EVs). From the Roadster (a very high-cost small-niche product) to the Model S (high cost, broader market) to the forthcoming Model 3 (moderate cost, even broader market) the company is seeking to reduce costs through R&D, learning by doing, and economies of scale.
They also benefit to a degree from “learning by waiting,” one aspect of which is spillover benefits from other sectors. Most notably, EVs benefit from improvements in lithium-ion batteries over the past 25 years, driven by the markets for laptops, tablets, and phones.

Tesla’s partner in the Gigafactory, Panasonic, built its expertise in batteries for consumer products. Tesla’s EVs benefit from all that Panasonic has learned, and continues to learn, in the consumer products market.
As I noted, declining incentives can encourage people to act now rather than waiting for somebody else to push the market forward. The United States has such an incentive for EVs. The federal tax credit of $7,500 per EV for the first 200,000 vehicles sold by a company, phasing out over the year after that, is not as gradual a decline as I might have suggested. By going all the way down to $0, it seems to omit consideration of climate and air quality benefits. Even so, it does provide a reason to act sooner rather than later if you are considering a Tesla or a Chevy Bolt.
The learning curve demonstrates the importance of pioneers. If you are considering solar panels or an EV, keep this aspect in mind: not only will you be helping reduce levels of greenhouse gas emissions, and possibly other pollutants, but you will be making the technology more affordable for everybody in the long run.
[1] It’s called a learning “curve” because the graph of price against cumulative volume is typically curved if each axis is linear (e.g. 1, 2, 3, 4, etc.). It is more of a line when each axis is logarithmic (1, 10, 100, 1000, etc.), as they are here.