The official end of the 2017 North Atlantic hurricane season, November 30th, has finally arrived. In the season’s wake many are mourning the loss of loved ones, repairing their homes, and still waiting for electricity to return.

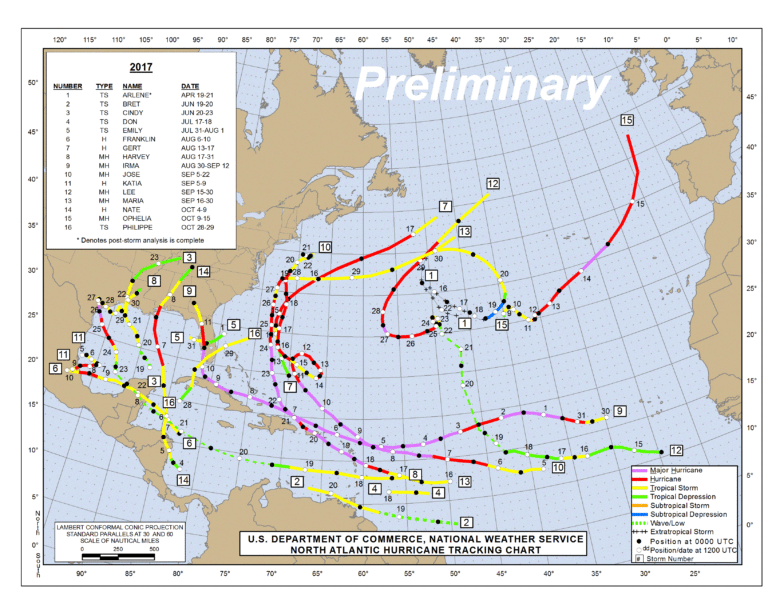
Figure 1. North Atlantic hurricanes and tropical storm tracks of the 2017 Season. Preliminary as the November storm tracks are not yet updated. Source: National Hurricane Center NOAA (http://www.nhc.noaa.gov/tafb_latest/tws_atl_latest.gif)
2017 North Atlantic Hurricane season was not normal
The first named storm of the 2017 Hurricane Season, tropical storm Arlene, began in early April. Harvey, Irma, and Maria are the names communities will remember long after they became major hurricanes.
Six of the ten hurricanes were major (greater than category 3). Recalling the headlines and seeing the damages, the season was catastrophic (Figure 1). Crunching the numbers on a measure of power – Accumulated Cyclone Energy (ACE) – confirms that impression. September 2017 ACE was more than three times greater than historical September ACE average over 1981-2000. Scientists are piecing together the factors that contributed to such an intense hurricane season. Attribution studies (studies that attribute the relative role of human and natural factors in the occurrence of extreme weather) are already been published about a specific Hurricane from 2017.
Some extraordinary conditions of this hurricanes season:

Figure 2. Warmer than 1985-2012 average sea surface temperatures (SSTs) during the time when tropical storm Ophelia transitioned into a hurricane south of the Azores Islands. Source: Climate.gov NOAA.
Warmer Seas – A big factor contributing to the intensification of Harvey, Irma, and Maria was the warmer than average sea surface temperature (SST) conditions. Another surprising consequence of the warmer than average SSTs was the hurricane region extended beyond typical hurricane regions of the North Atlantic Ocean. This allowed hurricane Ophelia to thrive in highly unusual latitudes and longitudes making it the easternmost hurricane to date (see storm track number 15 in Figure 1). The extratropical storm Ophelia made landfall in Ireland and brought waves that battered the UK coast, drenched northern Europe and blew winds that fueled lethal wildfires in southern Europe. Research suggests that heat-trapping emissions can extend the SST region favorable for hurricanes and increase the chances for these storms to head toward western Europe.

Figure 3. Record-breaking precipitation dropped along the Texas and Louisiana coastal region. Source: National Weather Service NOAA tweet https://twitter.com/NWS/status/902174274571689984
Record Breaking Precipitation – Hurricane Harvey dropped a whopping 60 inches in Nederland, Texas, east of Houston, breaking the 1950-2017 record for state maximum precipitation from tropical cyclones and their remnants. Hurricane Harvey’s average accumulated rainfall over Houston (840 mm or 33 inches) was exceptional. There was so much floodwater in Houston that it sunk the landscape by 2 centimeters (~0.8 inch) in some places. Assuming the precipitation area of individual hurricanes remains similar, Kerry Emanuel found that the return period for a greater than 500 mm (19.7 inches) average accumulated event precipitation was a once in a 100-year event over 1981-2000. This becomes a once in 16-years event by 2017 and a once in 5.5-years occurrence by the end of this century under an unabated emissions scenario.
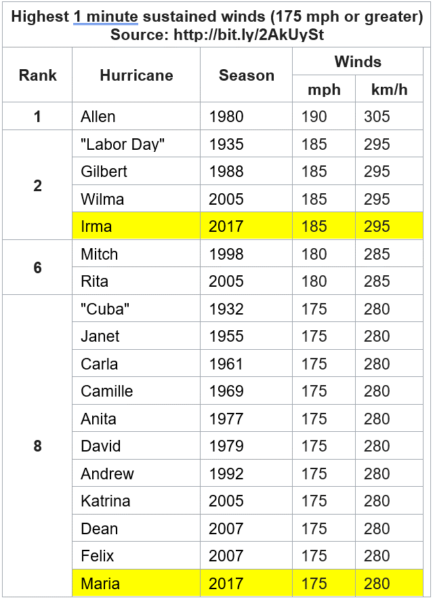
 Catastrophic Wind – A hurricane category is defined by sustained winds and the associated consequences are described by words such as “devastating damage” for category 3 and “catastrophic damage” for categories 4 and 5. Hurricanes Irma and Maria had unusually high peak 1-min sustained winds making the rank of North Atlantic Hurricanes with the strongest winds in the historical record (see table). Those on the ground during landfall withstood ferocious winds. Hurricane Maria was the first category 5 (157 miles per hour or higher sustained winds) hurricane to make landfall in Dominica—a small Caribbean Island south east of Puerto Rico. It made landfall yet again, but this time as a category 4 (130-156 miles per hour sustained winds), in Puerto Rico. Similarly, hurricanes Harvey and Irma made landfall as a category 4 storm in Texas and Florida, respectively.
How does an abnormal hurricane season become disastrous?
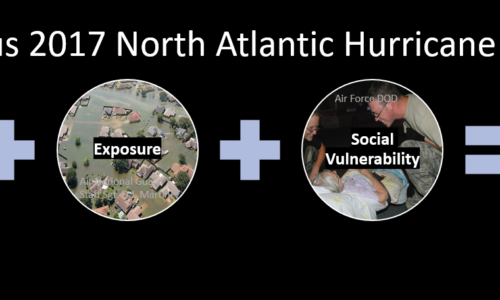
The Intergovernmental Panel on Climate Change has pointed to three major factors that can combine to influence the risk of an extreme event disaster. A weather and climate event plus communities exposed to that event plus the social vulnerability all combine to influence disaster risk.
Social vulnerability refers to the resilience of communities when confronted by external stresses. A few examples follow regarding the exposure and social vulnerability that intersected with hurricanes that are changing in a warming world.
Many Caribbean residents were among those exposed to these powerful hurricanes, which made repeated landfall on numerous islands this year.
For over three centuries people have lived on Barbuda and for the first time the risk was so grave that the entire island population fled to avoid exposure to Hurricane Irma. People are confronting rebuilding a community and civilization on Barbuda.
It is estimated that 3.7 million people, over a million households, nearly 260 billion dollars in Puerto Rico were exposed to wind impacts from Hurricane Maria. The fourth most populated U.S. City in 2017, Houston, was exposed to the precipitation deluge (see Figure 3) from Hurricane Harvey.
An entire metropolitan region, island or county might be exposed to an abnormal hurricane season, but not all of those in the path of a storm are equally vulnerable to its effects.
Differences in vulnerability have already emerged in the aftermath of the 2017 season that reflect in part the history of a place, people, and infrastructure. Additional factors include communication about the hurricane risks, first response and long-term disaster management. For example, elderly people perished in a Florida nursing home after days of being stuck in sweltering heat following the power outage caused by Hurricane Irma.
The U.S. Health Assessment found that people with chronic medical conditions are more likely to have serious health problem during excessive heat than healthy people. The elderly in this case depended on others for their care. As the USA Today Editorial Board put it “In such a climate, air conditioning is not a luxury for elderly people; it’s a necessity.”
Tragic loss of life from Hurricane Maria in Puerto Rico is estimated to be similar to Hurricane Katrina. This large toll is in part due to the vast numbers of U.S. citizens and residents still suffering from lack of safe drinking water or do not have access to power in Puerto Rico.
Families are piecing together their lives after a devastating loss of a family member. Or the absence of a child who had to evacuate to continue school in a safer place during a protracted recovery period.
2017 is the most expensive Atlantic Hurricane Season to date with damages already racking up over $200 billion. The epic disasters of the 2017 hurricane season hold important lessons, which should be taken into account when planning steps to better protect lives from Hurricanes and their aftermath. In turn those who are recovering from the disastrous hurricane season can learn from those lessons already learned from Hurricanes Sandy, Katrina, and Andrew.
These lessons can help communities rebuild toward climate resilience with principles that are scientifically sound, socially just, fiscally sensible, and adequately ambitious.

