

As the northern hemisphere steadily moves beyond the spring equinox, its time for a look back on the US winter season. With the arrival of spring, days stretch longer and bud bursts dazzle passersby, and we almost forget what the winter brought us in terms of extreme weather and that, as counter-intuitive as it may seem at times, winter is still very much a part of a warming world. And it is characterized by the changing behavior of the most unwelcome parts of any season: extreme weather.
Here we’ll review five notable patterns from this past cold season.
Cold season pattern #1: damaging ‘bomb cyclones’
The National Weather Service defines the winter season for the US as December through February and the cold season as November through March. The 2018–2019 winter season storm period kicked off with an exceptionally early Thanksgiving blizzard, and even now the storms aren’t quite over as Winter Storm Wesley is likely to break many April snow records.
Like other storms that are given names as they make headlines, Wesley is a rare bomb cyclone, a mid-latitude storm that undergoes a sudden and extreme drop in barometric pressure over 24 hours that leads to rapid intensification. (Note that the exact pressure drop over 24 hours that qualifies is based on the latitude.) As of this writing, Wesley was expected to bring blizzard conditions from Denver to the Minneapolis area, as well as hail to Kansas and eastern Nebraska.
It is rare to have a bomb cyclone within the continental United States, yet two have occurred this season. Along with Wesley, Winter Storm Ulmer (March 12-14) brought blizzard conditions, high winds, sudden melt of ground cover snow and subsequent devastating flooding that destroyed levees. Unfortunately, record-breaking bomb cyclone Ulmer made the US list of billion-dollar weather and climate disasters. During Ulmer, Denver set an all-time low pressure record (MSLP) and the strongest non-thunderstorm gust on record (80mph); gusts of 96 mph hit Colorado Springs; high winds derailed a train in New Mexico; and multiple stations logged gusts of more than 100 mph (San Augustin Pass, NM; Cloudcroft, NM; Pine Springs, TX).
Cold season pattern #2: Arctic outbreaks to the Lower 48
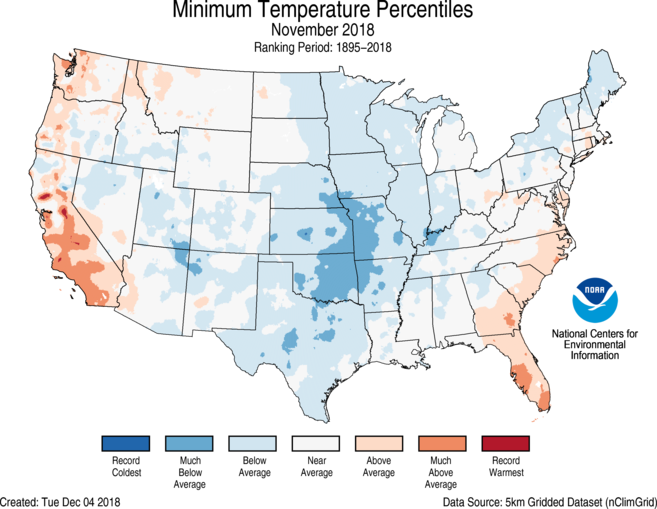
Repeated Arctic outbreaks of cold air into the Lower 48 were another feature of this cold season. These are tied to a weakening of the stratospheric polar vortex. Marking an early start to the cold season, Kansas City, Missouri, logged the coldest November temperature on record, with much of the Lower 48 registering below average or much below average minimum November temperatures. Illinois set an all-time record low of -38 degrees Fahrenheit on January 31, 2019.
Imagine what these cold temperature records (as registered on an official thermometer) actually felt like if you were outside and exposed to blowing winds, with increased chances for hypothermia under severe windchill. One Arctic outbreak included a winter storm that brought snow from the northern plains to the Great Lakes and the Northeast; the coldest temperatures in years to the Midwest; and closed schools, cancelled flights, and, tragically, brought an associated weather-related death toll.

Figure 1. Examples of cold outbreaks (Jan 29 and April 11 of 2019). Image source: ClimateReanalyzer.org.
Cold season pattern #3: abundant snowfall
Many winter sports enthusiasts enjoy their favorite activities after a fresh snowfall and this cold season brought abundant snow November through February. he repeated Arctic cold outbreaks helped because when precipitation occurred, it often fell in the form of snow versus rain, which has been a problem cropping up more frequently in recent seasons. The ski industry welcomed a much needed boost in visitors and winter gear sales.

Figure 2. Inches of snowfall for November 2018 through February 2019. Image source: NOAA
Cold season pattern #4: intense precipitation and flooding
This winter season also featured an emerging El Niño, a phase of a natural Pacific Ocean cycle that can bring wet conditions to the southern US region during winter. When storm tracks bring moisture from lower latitude ocean regions (such as the Pacific or the Gulf of Mexico) these can dump intense precipitation over the US. Such events were also a feature of this season and brought devastating flooding to many communities in the US.
Unfortunately, this is another pattern emerging over recent years in a warming world and one that was on full display in Louisiana, where the Bonnet Carré Spillway had to be opened for only the thirteenth time since its construction to protect the city of New Orleans from floodwaters of the Mississippi River. We notice (and I have seen it opened myself during a random winter visit to the city) that it has been opened more frequently in recent years, and that this season marks the first time that the spillway was opened in consecutive years for the first time in its 88-year history.
Cold season pattern #5: unseasonably warm Alaska
To top off this look back toward the cold season, we find that Alaska was unseasonably warm. The records were for record warmth compared to historical cold season trends and were such that traditional dog sled races had to be cancelled. Perhaps no surprise as recent years we have read headlines that remark on the truckloads of snow being brought to Anchorage to allow the start of the Iditarod, Alaska’s most famous dog sled race.
It all adds up to record-breaking extreme weather for the US during this past winter season. As the Intergovernmental Panel on Climate Change special report on extreme weather has noted, one of the signatures of climate change is more extreme weather events. Winter 2018-2019 in the US was no exception.

Figure 3. The entire state of Alaska this winter had above or much above average maximum temperature. Source: NOAA