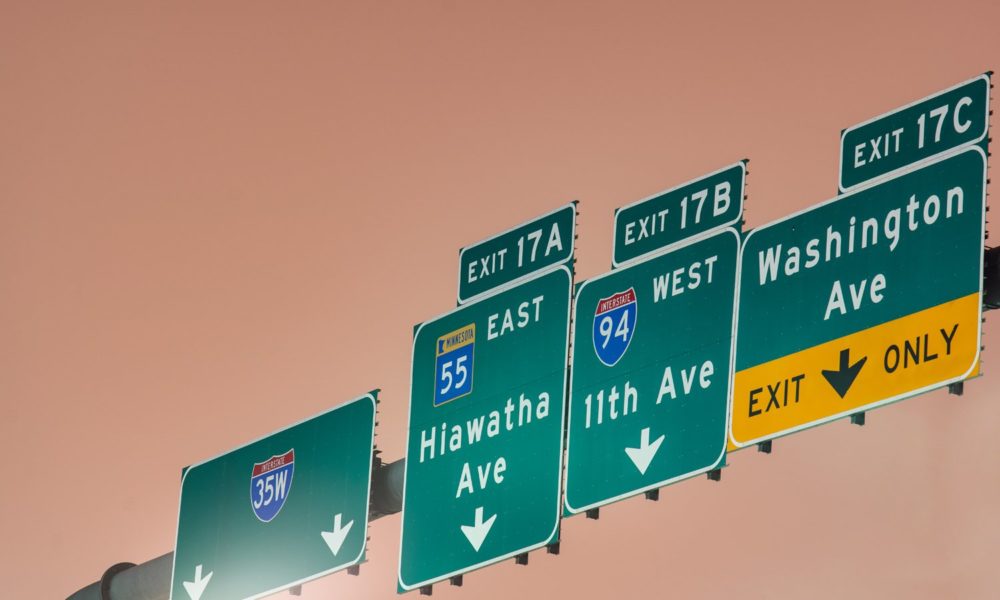

Most people know that cars, trucks, and buses from our highways and city streets are a significant source of harmful air pollution. While this pollution impacts all communities in the state to some degree, Minnesotans who face the greatest exposure to transportation pollution are those who live near highways, along major freight corridors, and in urban areas.
To help understand exactly which communities bear the greatest burden and breathe the highest concentrations of this dangerous air pollution, we used a model to estimate the amount of fine particulate matter air pollution (known as PM2.5) produced by on-road vehicles that burn gasoline and diesel. The findings, which are not likely to be a surprise to many residents, are quite troubling – they show that people of color are disproportionately exposed to vehicular PM2.5.
What is PM2.5 and why is it so important?
The science is clear: no level of particulate matter is safe to breathe, says the American Lung Association. Although PM2.5 is not the only air pollutant that adversely affects health, it is estimated to be responsible for approximately 95 percent of the global public health impacts from air pollution.
PM2.5 include particles smaller than 2.5 millionths of a meter in diameter – about 30 times smaller than the diameter of fine human hair — so they can penetrate deeply into the lungs. The ultrafine particles – smaller than 0.1 millionths of a meter – are particularly dangerous, as some can enter into the bloodstream.
Chronic exposure to PM2.5 causes increased death rates attributed to cardiovascular diseases, including heart attacks and strokes, and has been linked to other adverse impacts such as lung cancer, reproductive and developmental harm and even diabetes and dementia. Chronic exposure to PM2.5 in children has also been linked to slowed lung-function growth and the development of asthma. The Minnesota Pollution Control Agency (MPCA) and the Minnesota Department of Health recently published a report showing that in 2013, approximately 2,000 to 4,000 deaths in the state could be attributed to fine particulate matter and ozone pollution.
PM2.5 is formed in many ways. A significant source of PM2.5 is fuel combustion. The combustion engines of cars burn gasoline and diesel. Power plants burn natural gas and other fuels to produce electricity. Burning wood for cooking and in fireplaces, as well as wildfires, are examples of biofuel combustion. Not only does burning fossil fuels and biofuels produce PM2.5 directly, but the combustion reaction also emits gases such as nitrogen oxides, sulfur dioxide and volatile organic compounds that go on to form additional PM2.5 through complex chemical reactions in the atmosphere.
Greater pollution for people of color
The results are clear: PM2.5 pollution burden from cars, trucks, and buses is inequitably distributed among racial and ethnic groups in the state. People of color experience an undeniable “pollution disadvantage.”
We estimated exposure to PM2.5 pollution using a recently developed model from the University of Washington, and data from the EPA’s National Emissions Inventory and the US Census Bureau. This model allowed us to calculate how vehicle tailpipe and refueling emissions ultimately lead to ground-level pollution exposure, so we can understand how exposure to PM2.5 varies among groups and locations.

Figure 1. Disproportionately High PM2.5 Exposure for African Americans and Latinx residents in Minnesota. The number in the horizontal axis shows the population of each racial group in Minnesota. We omitted certain demographic because their low populations prevented our model from estimating statistically significant exposure levels. Since we are using census data, it is important to acknowledge that certain populations, namely indigenous communities, have been historically underrepresented in American Community Survey census data while often bearing a disproportionately high pollution burden.
Looking at the state as a whole, African Americans are exposed to 65 percent higher PM2.5 concentrations from on-road transportation than the average PM2.5 exposure for all Minnesotans. Latinx residents experience concentrations 28 percent higher than the average resident (Figure 1). At the same time, white residents have an average exposure that is 9 percent lower than the average for the state.
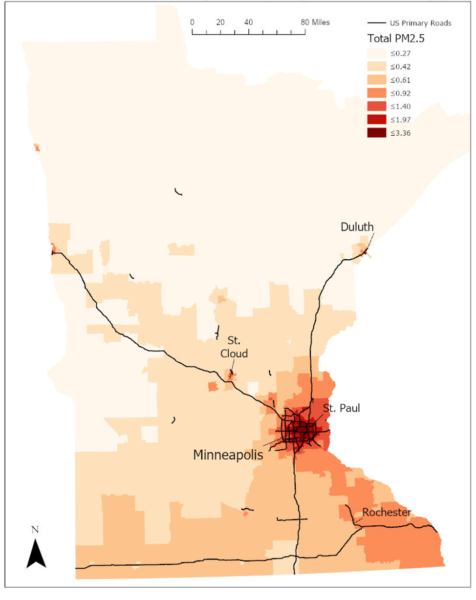
Figure 2. PM2.5 exposure varies greatly within Minnesota. PM2.5 is measured in (μ/m3)
Furthermore, PM2.5 exposure varies greatly within Minnesota (Figure 2). Ramsey County is exposed to the worst pollution levels, with an exposure that is 116 percent higher than the state average, followed by Hennepin County with an exposure that is 54 percent higher than the state average. Together, these two counties in which Saint Paul and Minneapolis are located, are home to almost one third of the state’s population, which means that more than 1.7 million people are affected by this high level of fine particulate matter from cars, trucks and buses. Figure 3 compares the exposure of the 5 most populated counties relative to the state average.
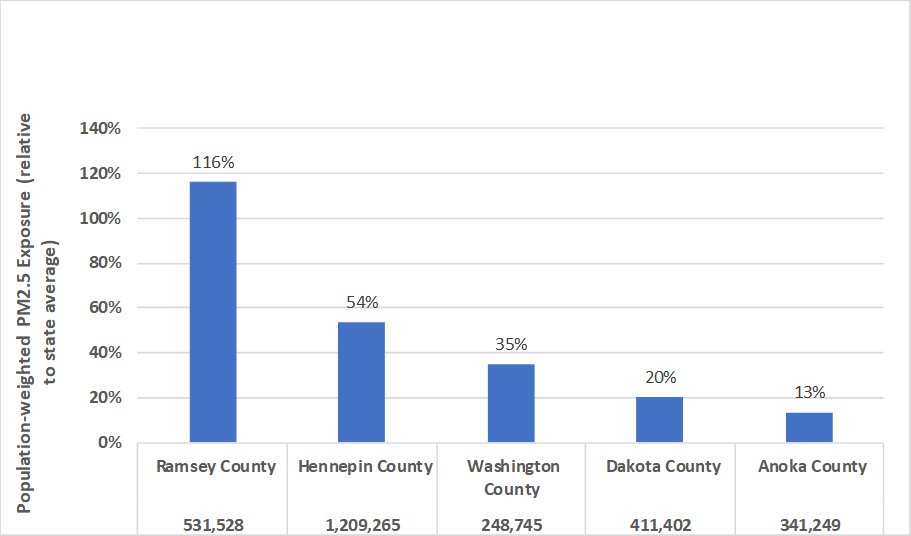
Figure 3. The PM2.5 exposure of Ramsey, Hennepin, Washington, Dakota and Anoka counties relative to the state average. The percentages show the amount by which each county is above the state average. The number in the horizontal axis shows the county population.
The analysis also shows that less affluent households have a higher exposure to air pollution than more affluent households, although this disparity is not as pronounced among income brackets as it is among racial and ethnic groups. One of the most striking examples is in Hennepin County, where our analysis shows that the lower the income, the dirtier the air breathed by those households. Figure 4 shows this trend. Those earning less than an annual $20,000 breathe air that is 25 percent more polluted than the county average, while those earning more than $200,000 breathe air that is 15 percent cleaner than the county average.
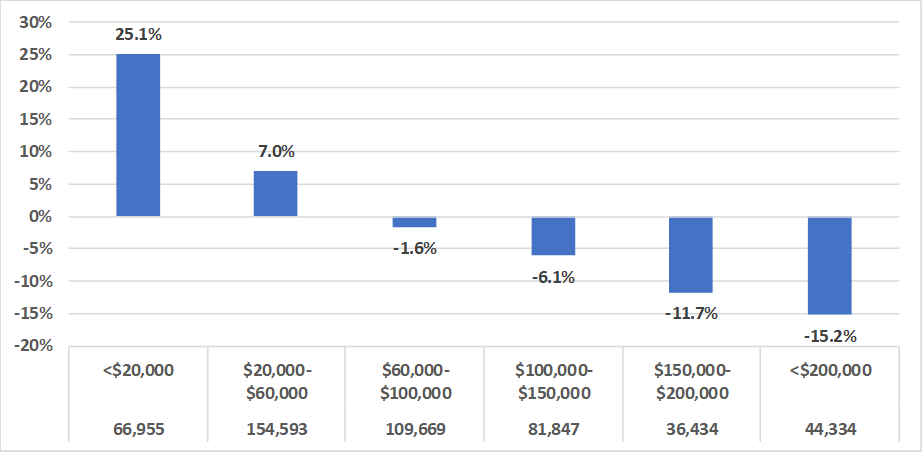
Figure 4. Income air pollution inequity in Hennepin County. The number in the second row of the horizontal axis shows the number of households in each income bracket.
What is to be done?
Minnesota should use clean vehicle policies to reverse a history of local, state, regional, and national decisions about transportation, housing, and land use that have led to and perpetuate inequitable air pollution burdens. Decisions concerning where to construct highways, where to invest in public transportation, and where to build housing have all contributed to a transportation system that concentrates emissions in communities of color. With the inclusion of affected communities in the state’s rulemaking and other decision-making processes relating to emissions reduction from transportation, Minnesota is being handed an opportunity to address the consequences of decades of misguided decisions.
The state’s economy is growing, Minnesota residents are buying larger, less efficient and more polluting cars, and they are driving more. Although newer and more efficient vehicles pollute less, the trend towards larger cars and longer distances offsets much of this benefit. Also, there are more and more freight trucks on our highways. Together, cars, trucks and buses are responsible for the vast majority of our transportation climate emissions. In Minnesota, 70 percent of the state’s greenhouse gases from transportation come from passenger cars and light-, medium- and heavy-duty trucks. Since local air pollutants such as health-damaging fine particulate matter are emitted at the same time as climate-damaging greenhouse gases, our on-road vehicles have a large role to play in both the air pollution and climate fronts. These two forms of pollution grow hand-in-hand, and need to be confronted hand-in-hand as well.
The Next Generation Energy Act (NGEA) from 2007 has helped Minnesota make some progress in reducing emissions from its economy, but the state has already missed the first goal of the NGEA. Instead of the targeted 15 percent emissions reduction in 2015 relative to a 2005 baseline, only 5 percent was achieved. Looming ahead is the 2050 goal, a whopping 80% reduction relative to 2005. Transportation became the largest source of greenhouse gases in the state in 2016, so we must focus on reducing emissions from this sector to help achieve this overall goal.
While residents can make a difference for local air pollution, as well as for climate emissions, by choosing cleaner vehicles and driving less, much of today’s air pollution comes from sources outside the direct control of individuals. Minnesota needs regulations, incentives, and other policies to reduce vehicle emissions. Inequity also needs to be addressed with equal urgency, so the meaningful involvement of affected communities are key considerations in designing policies and strategies to reduce pollution from vehicles.
Minnesota should move forward with adopting California’s clean car standards, as thirteen other states have done. Minnesota is strongly considering adopting both the Low- Emission Vehicle (LEV) and the Zero-Emission Vehicle (ZEV) standards. The LEV standard requires automakers to sell vehicles that meet the more stringent emission standards established by California, and the ZEV standards requires them to increase the percentage of low- or zero-emission vehicles (such as plug-in hybrids and battery electric vehicles (EVs) sold in the state. The electrification of vehicles, both passenger and freight, can greatly reduce emissions, since battery-electric vehicles have no tailpipe emissions and also eliminate emissions associated with gasoline refueling. The state is in the early planning stages of this process, but is facing resistance from auto dealers and the oil and gas industry, so implementing these important standards will require ongoing and concerted efforts.
Minnesota is already engaged or contemplating specific actions which could reduce air pollution and its inequitable distribution. For instance, the Minnesota Public Utility Commission requires utilities to file plans and programs for EV charging and rates. Time-of-use rates allow utility customers to charge during off-peak hours at a reduced energy rate. Metro Transit has plans to purchase and use electric buses in 2020 and 2021.
Other specific actions are:
- A transition to cleaner and more efficient public transportation fleets, as well as the expansion of public transportation.
- Programs for the deployment of electric trucks and buses. Electric school buses and transit buses are examples of segments that are ready and well-suited for early adoption. A pilot program of electric school buses should focus on serving communities exposed to the highest levels of gasoline and diesel emissions.
- An electric vehicle rebate program that provides financing assistance and larger rebates to low- and moderate-income residents, as well as excise tax credits for the purchase of plug-in vehicles.
- Utility investments in electric vehicle charging infrastructure, with a priority on serving communities exposed to the highest levels of gasoline and diesel emissions.
Air pollution from on-road transportation such as diesel and gasoline vehicles places significant, inequitable and unacceptable health burdens on Minnesotans. We have the tools and the technologies to transform our transportation system away from diesel and gasoline and toward clean, modern, and equitable solutions. However, state leadership is critical, especially at a time when the federal government is rolling back federal fuel economy and greenhouse gas emissions standards for passenger cars and light trucks.
Minnesota needs to continue the effort to reduce air pollution from vehicles, placing a high priority on actions that reduce the inequitably distributed burden of air pollution in the state. This air quality analysis provides important quantitative evidence of the need for and importance of such programs, and it can help inform and shape future actions to reduce on-road transportation pollution exposure and inequities in the state.