To some, “Fabulous Five “ brings back memories of the 1991 recruits for the University of Michigan’s basketball team—Chris Webber, Jalen Rose, Juwan Howard, Jimmy King, and Ray Jackson. The five powered Michigan to the NCAA Division I championship games in 1992 and 1993.
Others may recall the “Fab Five,” a made-for-TV movie about a 2006 cheerleader scandal at a high school in Texas.
No one hearing “Fabulous Five” thinks about the performance of the nuclear reactors owned and operated by Entergy between 2011 and 2015. The performance during those five years was anything but fabulous, unless fabulously bad counts.
Performance Reports
Every quarter, the Nuclear Regulatory Commission (NRC) takes operating data submitted by plant owners and findings by the NRC’s inspectors to assign each reactor to one of five columns in the agency’s Action Matrix. When performance meets or exceeds NRC’s expectations, a reactor is placed in Column 1. If performance levels drop, a reactor gets placed into Columns 2, 3, or 4 depending on the depth and breadth of the performance decline. When performance drops so low that operation is not permissible until problems are corrected, a reactor falls into Column 5. The NRC began using this rating system in the fourth quarter of 2000.
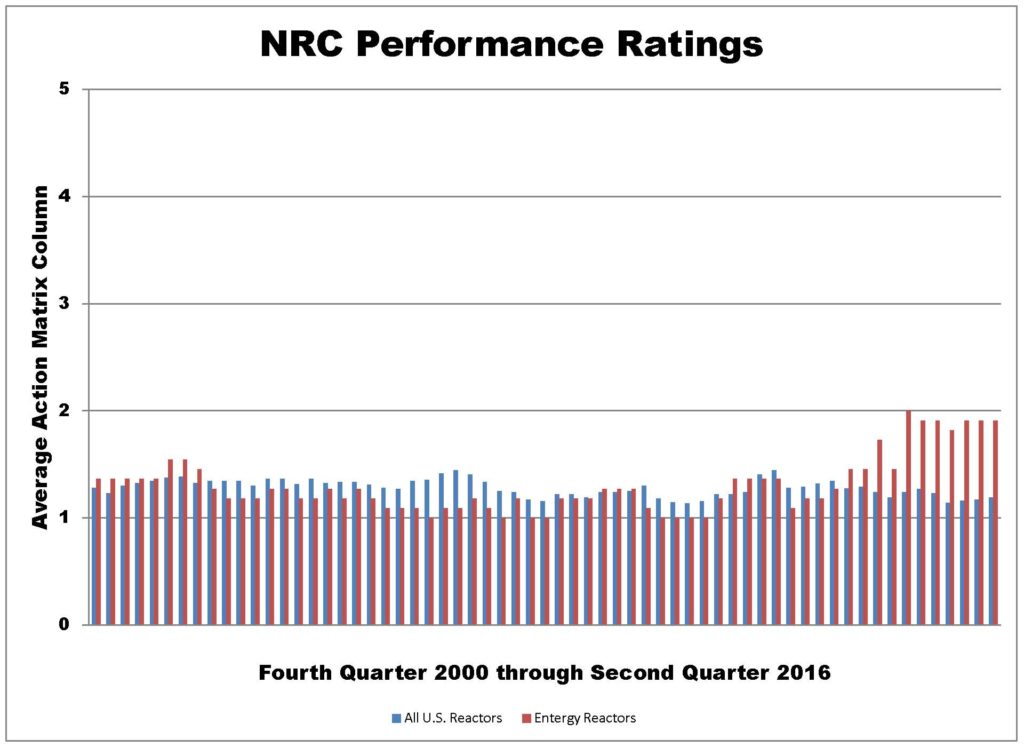
Back in 2000, there were 105 reactors operating in the United States. Several reactors permanently shut down and one reactor commenced operating for a current total of slightly under 100 operating reactors. Entergy operated 11 reactors during much of that period, with one reactor permanently shutting down in recent years. Based on the average Action Matrix column placement, Entergy’s reactors generally outperformed the U.S. reactor fleet between 2000 and 2010 as shown in Figure 1. (Action Matrix column placement is like golf scores—low numbers win.) But the performance of Entergy’s reactors significantly declined beginning in 2011.

Fig. 1 (Source: Union of Concerned Scientists)
Performance Plunge
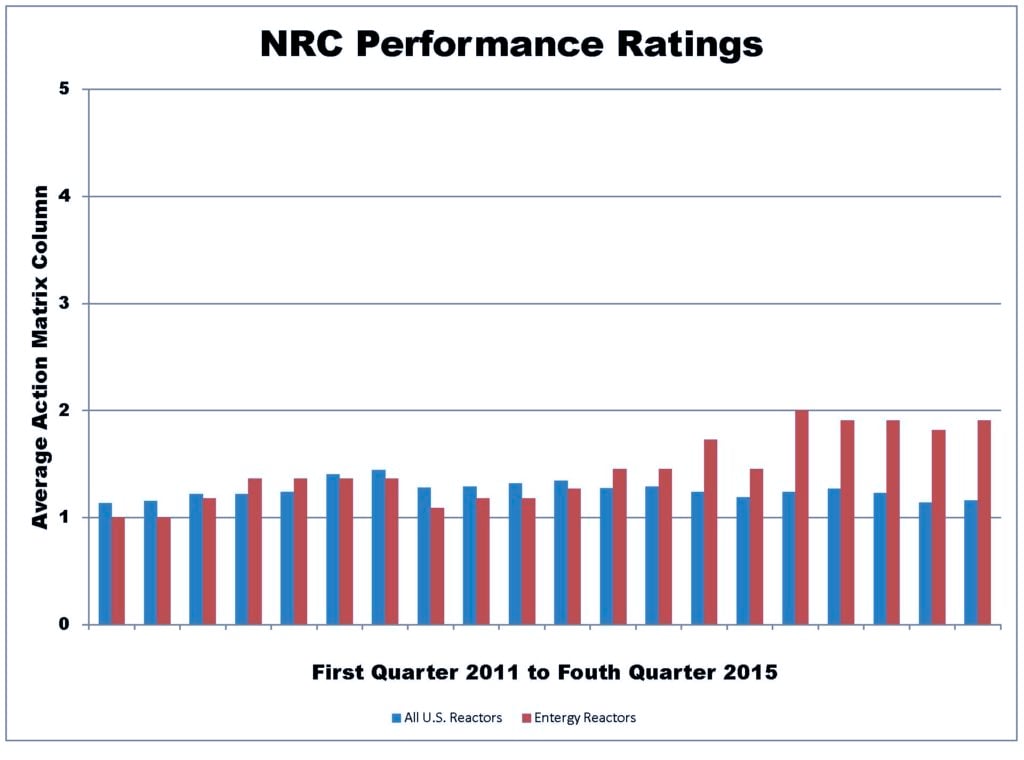
Figure 2 shows a closer look at this five-year period. For the first and second quarters of 2011, all eleven of Entergy’s reactors were placed by the NRC into Action Matrix Column 1. Those ratings reflect top performance—the NRC does not issue 1-plus scores. By fourth quarter 2014—just 14 quarters later—the average Entergy reactor was in Action Matrix Column 2. The performance difference between Entergy’s reactors and all U.S. reactors was wider than ever, and not in Entergy’s favor.

Fig. 2 (Source: Union of Concerned Scientists)
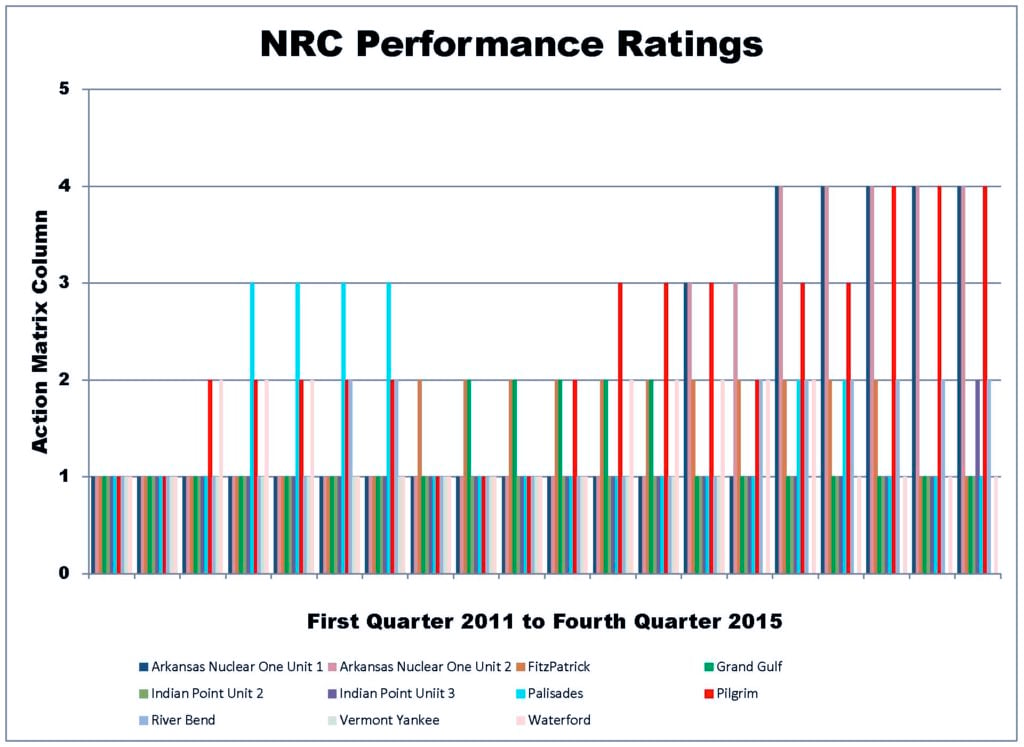
But 10 to 11 reactors is a smaller sample than 98 to 105 reactors. Perhaps one poorly performing reactor is dragging down the Entergy fleet. Figure 3 belies that notion. Only two of Entergy’s eleven reactors remained in Column 1 each and every quarter between 2011 and 2015: Indian Point Unit 2 and Vermont Yankee. The other nine reactors visited Columns 2, 3, and 4.

Fig. 3 (Source: Union of Concerned Scientists)
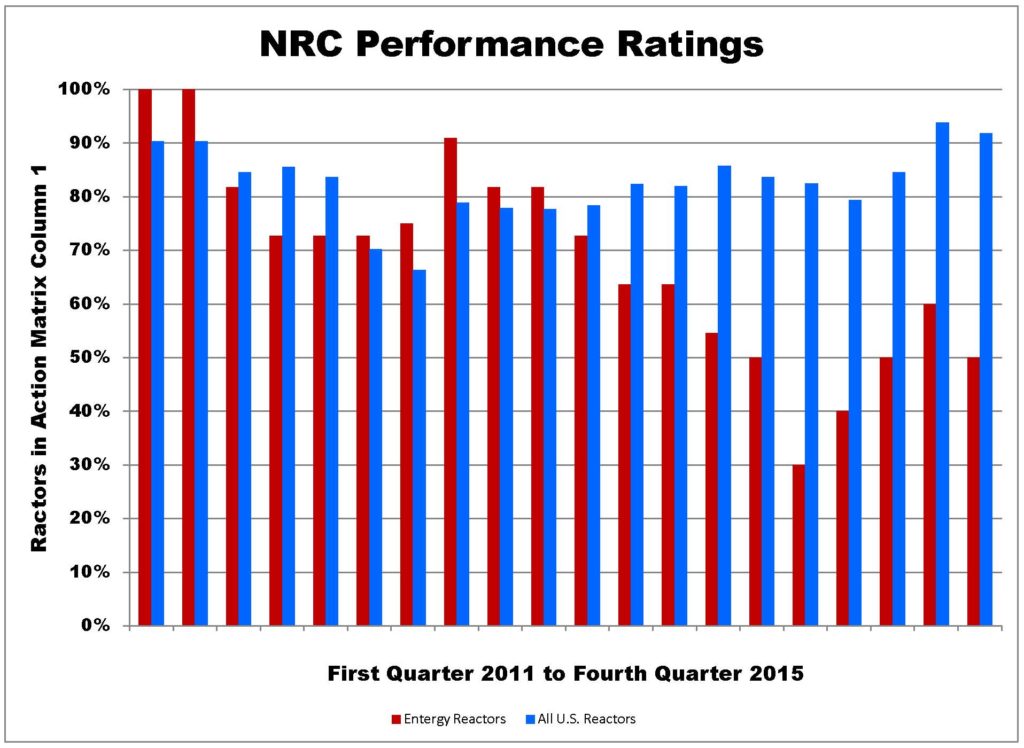
The individual Entergy reactor ratings are hard to discern. Only people who do extremely well on ink blot tests and those who can relax their minds to see prancing unicorns or frolicking grizzly bears emerge from squiggly line drawings can get much out of Figure 3. The rest of us can hopefully gain these insights from Figure 4. This figure shows the percentage of U.S. and Entergy reactors placed into Column 1 each quarter by the NRC from 2011 to 2015. For the first and second quarters of 2011, 100 percent of Entergy’s reactors resided in Column 1—a feat the U.S. reactor fleet has never achieved. But by the fourth quarter of 2014, only 30 percent of Entergy’s reactors remained in Column 1. It was clearly not a case of one bad apple spoiling the bushel, but a fleet with bushels of reactor performance problems.

Fig. 4 (Source: Union of Concerned Scientists)
Bottom Line
The NRC rates performance for each individual reactor. For example, the NRC has rated performance for Indian Point Unit 2 as being in an Action Matrix column while placing Indian Point Unit 3 in another column, despite the reactors being side-by-side at the same site under the same management. Such granularity has its advantages. Like snowflakes, no two reactors are identical and their differences can, and do, factor into performance differences.
The NRC does not connect these individual dots to see the bigger picture. Thirty percent of Entergy’s fleet rated outside of Column 1 cannot be explained by a faulty design, an incapable senior manager, or poor relationships between work force and management. Bad luck might explain an underperforming reactor or two. But bad luck does not cause performance to drop at 70 percent of the Entergy fleet. At times, individual snowflakes team up to cause blizzards.
When its performance assessments reveal broad underperformance by the owner of a fleet of nuclear reactors, the NRC must determine whether bad corporate behavior is spoiling the bushel of reactors. The NRC need not give aptitude tests to Chief Nuclear Officers or examine budget allocations. The NRC could simply issue a “Show Cause” order to the owner requiring a formal response as to why so many of its reactors have performance problems.
When many among a fleet of ships is listing, taking on water, or steaming off-course, it would be irresponsible to wait until a ship sinks before asking the Admiral of the Fleet “what’s up?” NRC cannot wait for a reactor to meltdown before asking Entergy to explain why so many of its reactors are experiencing so many problems.
