When something happens at a U.S. nuclear power reactor like an unplanned shut down or problem that prevents operation at full power, it can be helpful to place that incident in context. One means of providing that context is to examine that reactors’ operating performance. The Nuclear Regulatory Commission posts information online that can help. Each work day, the NRC posts a data set containing the daily power levels reported for each nuclear power reactor in the country during the past year.
Each entry in the data set contains a date, the reactor’s name (e.g, Indian Point 2) and the percentage of rated power (i.e., 0 to 100).
The data set can be easily downloaded as a text file and imported into a spreadsheet program like Excel to allow the data to be examined. Those steps for Excel are:
- Go to http://www.nrc.gov/reading-rm/doc-collections/event-status/reactor-status/
- Right click on the “Power Status (raw data text file) for the last 365 days” link and use “Save target as …” to download this file to your computer
- Start the Excel program
- Select the “Data” tab across the top
- Doubleclick on the “From Text” icon at the upper left and select the text file downloaded to your computer in Step 2
- Verify that the first step of Text Import Wizard seeks to import Delimited data (rather than Fixed Width data) starting at row 1, then click the “Next” button
- Change the Delimiters option in the second step of the Text Import Wizard from using “Tabs as Delimiters” to “Other”, and enter a vertical line (| which appears on a standard keyboard as a capital backslash, \) in the white box to the left of “Other”, then click the “Next” button
- Change the Column data format for the first column in the third step of the Text Import Wizard from “General” to “Date (MDY)” and then click the “Finish” button
- Place the data into the existing spreadsheet by clicking the “OK” button
The data will be sorted from the power levels for each reactor 365 days ago at the top and the power levels from today at the bottom. Excel can be used to resort the data by reactor (column B) and date (column A) to facilitate reviewing individual reactor performance.
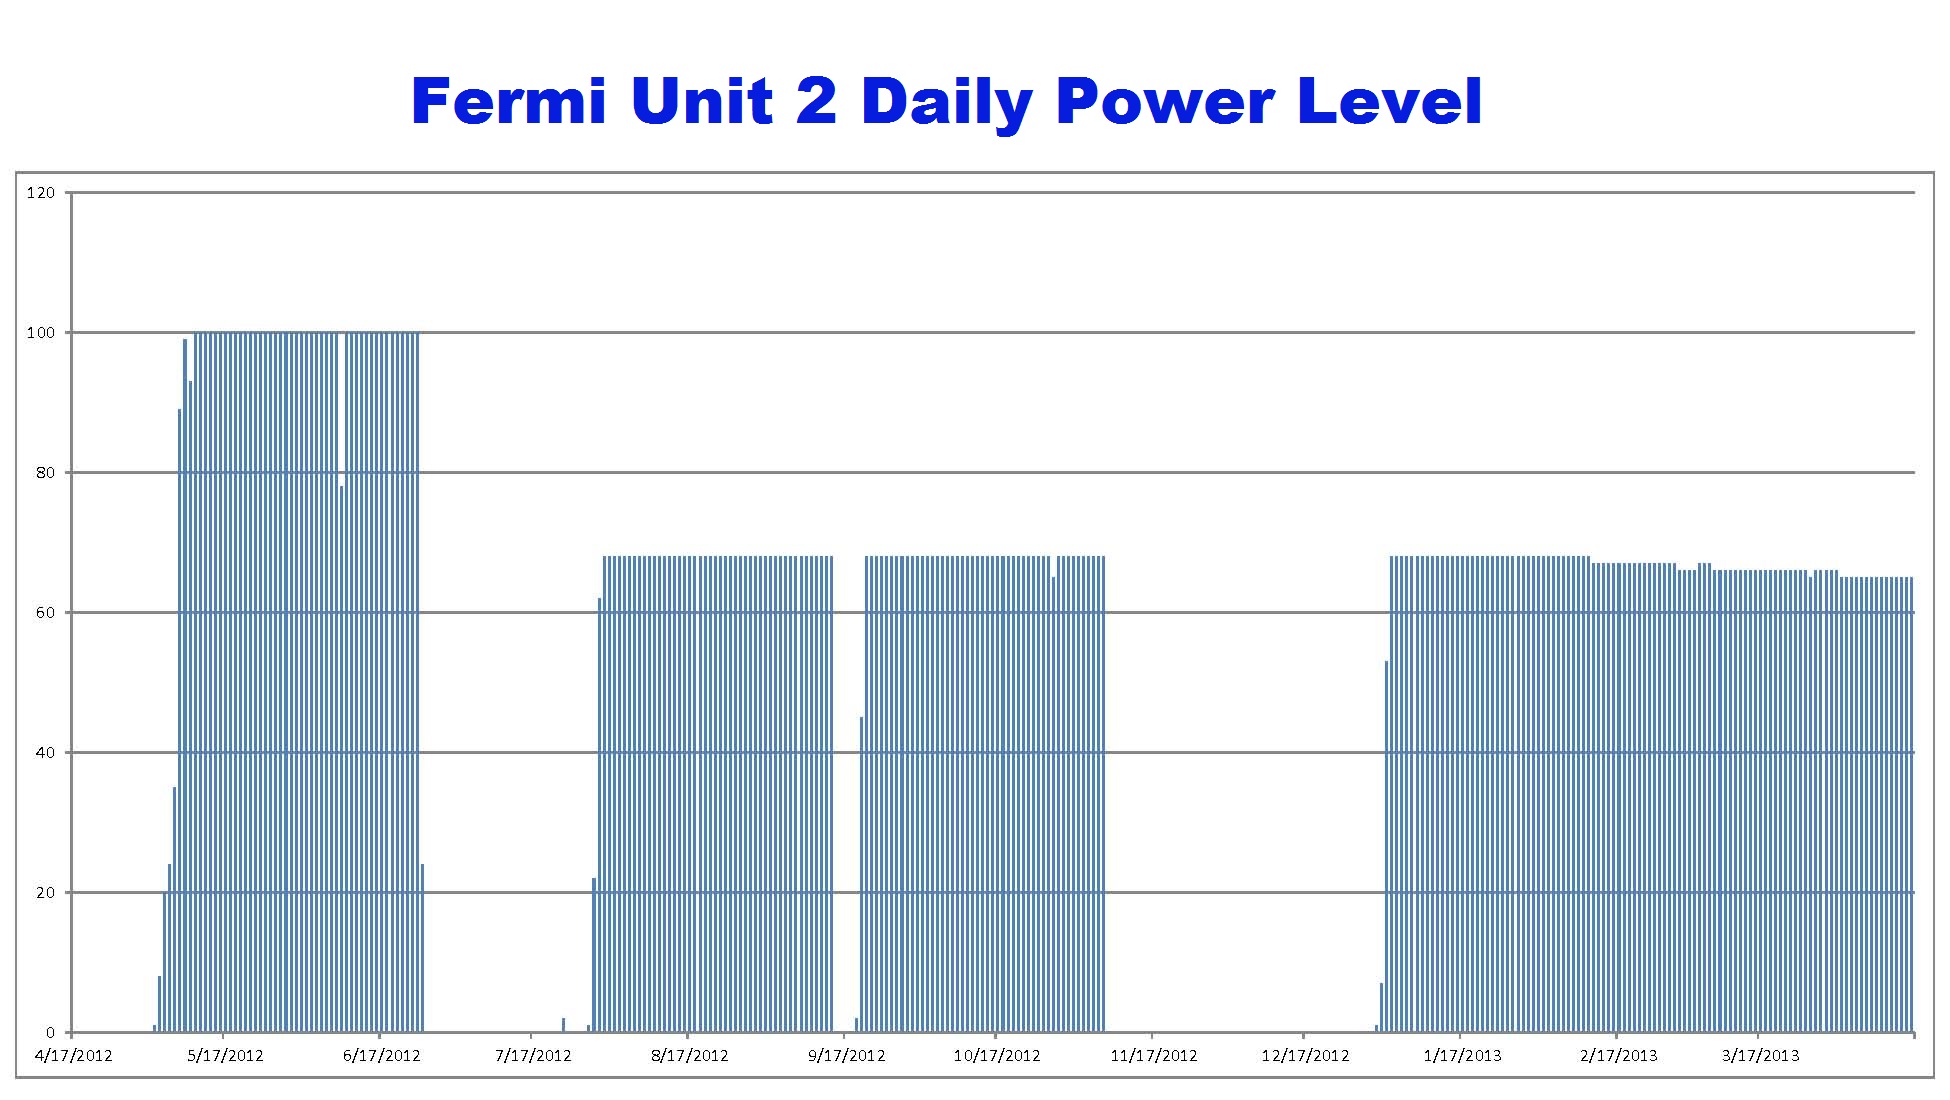
For example, the figure shows the daily power levels reported for the Fermi Unit 2 reactor in Michigan between April 18, 2012, and April 17, 2013. The plot shows a number of times when the reactor was shut down as well as prolonged periods when the reactor operated at reduced power levels. Although the data set doesn’t provide an explanation, other sources indicate that a broken feedwater pump prevents Fermi Unit 2 from achieving full power.
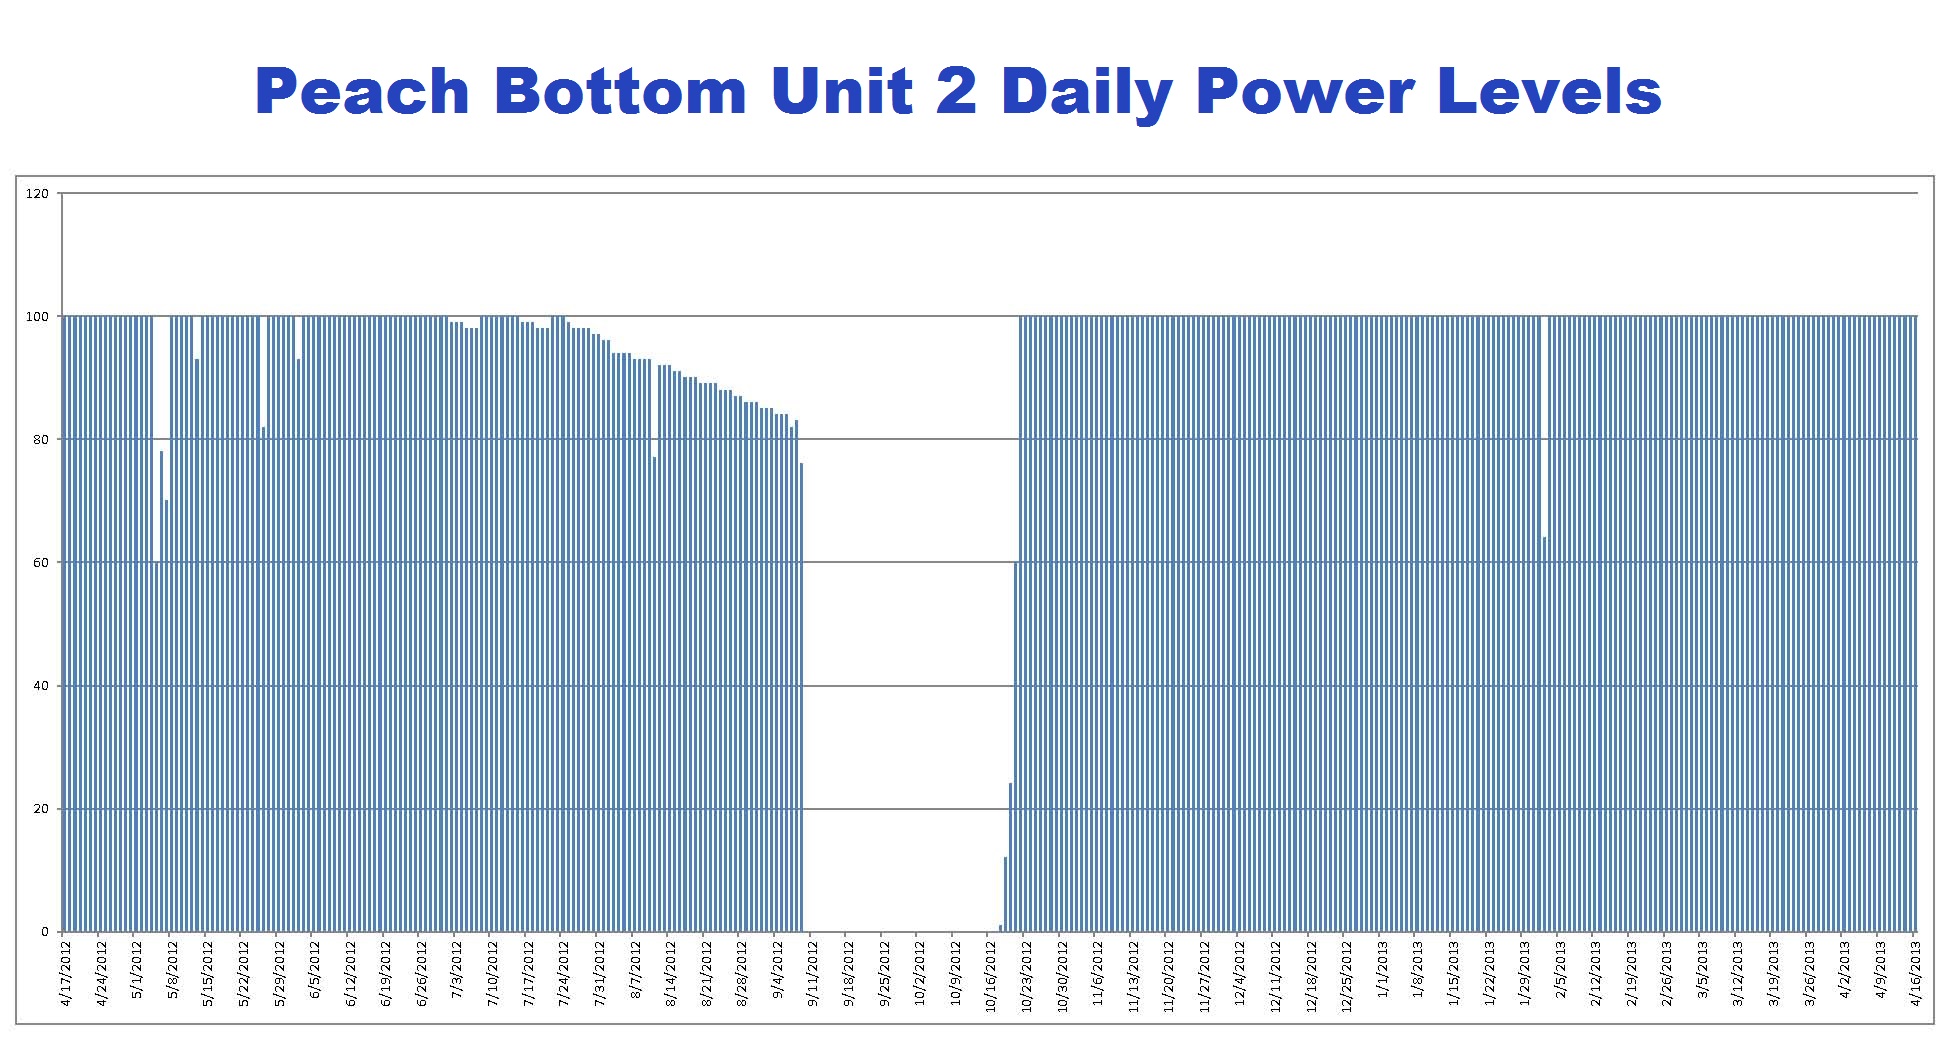
The plot for Peach Bottom Unit 2 shows the reactor was shut down in September and October 2012 and generally operating at full power otherwise. Again, other sources reveal that a refueling outage explains the downtime in fall 2012. Circumstantial evidence from the plot reinforces this fact – the steady decline in reactor power level from late July 2012 until the reactor was shut down in September is suggestive of a coastdown as the consumption of uranium and plutonium atoms in the nuclear fuel no longer enabled the reactor to achieve 100 percent power.
A future NEAT post will cover the monthly operating reports available in the NRC ADAMS online library that can be consulted to explain why reactors are not operating at full power.
The UCS Nuclear Energy Activist Toolkit (NEAT) is a series of post intended to help citizens understand nuclear technology and the Nuclear Regulatory Commission’s processes for overseeing nuclear plant safety.


