Nuclear Energy Activist Toolkit #24
Since spring of 2000, the NRC uses its Reactor Oversight Process (ROP) to assess safety levels at the nation’s operating nuclear power reactors. For about two decades prior to the ROP, the NRC used its Systematic Assessment of Licensee Performance (SALP) process. While neither process is perfect, the ROP is less imperfect than SALP.
SALP evaluated performance in large areas over extended periods. Over the years, the number of areas evaluated for SALP varied from four to seven. The SALP assessments were conducted every 18 to 24 months. It was easy for to mine such large data fields to cherry-pick a handful of examples needed to support preconceived notions that reactor X was doing superbly while reactor Y was performing dreadfully. And when the NRC cited examples from nearly two years ago when concluding reactor Y was performing dreadfully, owner Y could easily dodge that criticism by claiming maybe it was back then, but it certainly not true now.
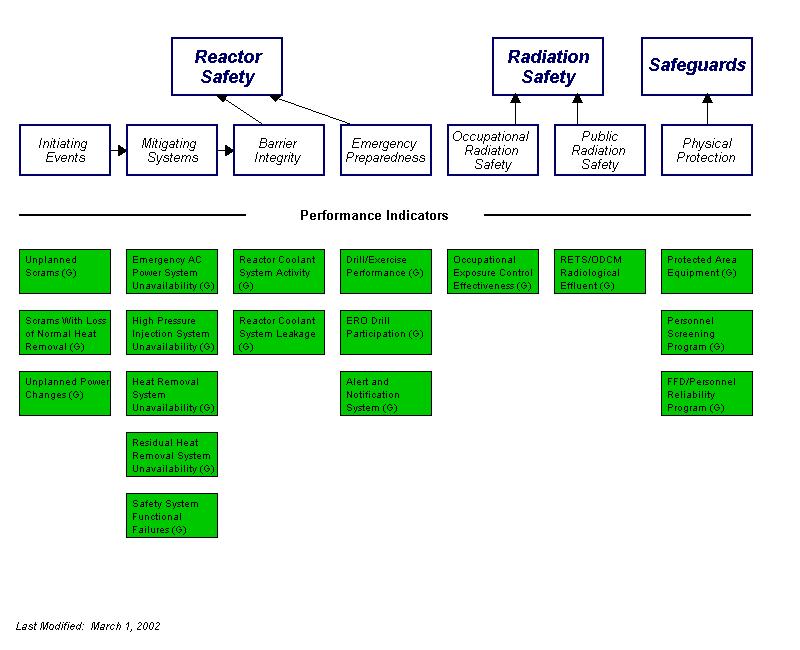
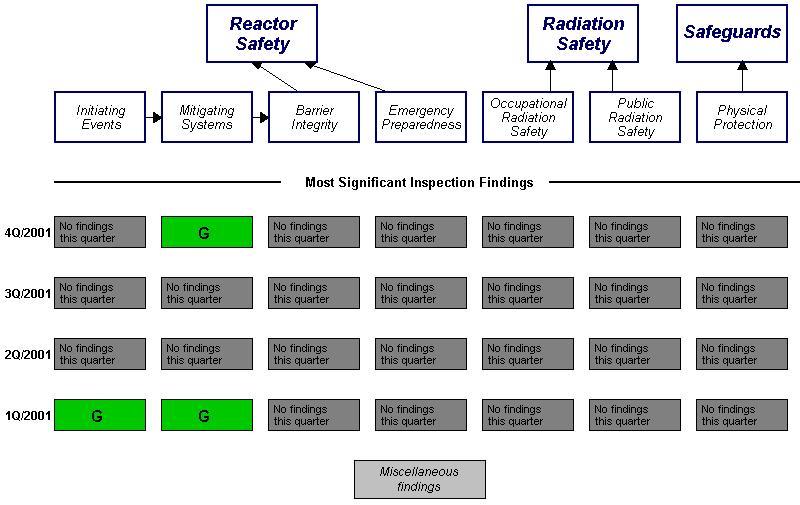
The ROP avoids most of SALP’s problems. Instead of assessing performance levels every 18 to 24 months, the ROP’s assessments are conducted every three months. Instead of grading performance in four to seven broad categories, the ROP examines performance in 24 areas (17 performance indicators coupled with NRC inspector findings from 7 cornerstones.)
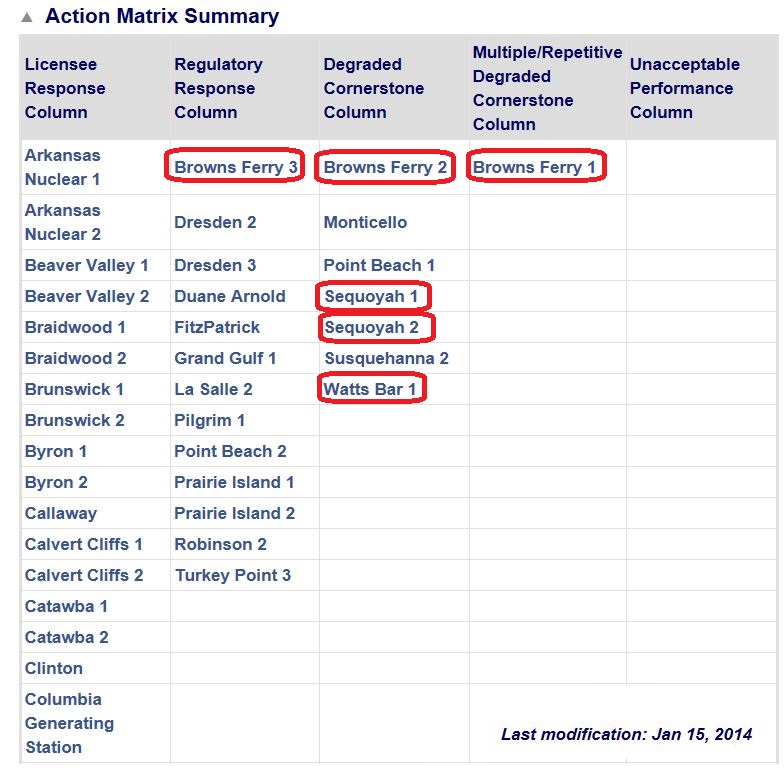
The ROP assigns four colors to distinguish different performance levels. Red indicates the lowest performance level, with yellow, white and green showing increasingly better performance. Each quarter, the NRC looks at the “rainbow” of colored performance indicators and NRC inspector findings to place reactors into five columns on the Action Matrix. When all colors are green, reactors fall into the left-most column. As the performance palette broadens to include more colors other than green, reactors move right-ward across the Action Matrix columns.
In theory, ROP should detect declining performance levels before they grow to epidemic levels by evaluating discrete areas more frequently.
Bottom Line
The ROP is better than the SALP process it replaced, but still has imperfections.
The Davis-Besse nuclear plant in Ohio illustrated the ROP’s imperfections. For the first quarter of 2002, the ROP had only green colors for the reactor, leading the NRC to believe it was the top performer among all reactors operating in the Midwest. Yet Davis-Besse shut down that quarter and remained shut down for over two years as an army of workers undid damage caused by nuclear neglect. By the owner’s own concession, it had placed production ahead of safety, allowing safety margins to be compromised. The NRC calculated that the problems put Davis-Besse closer to meltdown than any U.S. reactor had ventured since the Three Mile Island accident in March 1979. An evaluation system that mistakes the worst for the best clearly needs some re-calibration.
The Action Matrix on January 15, 2014, showed 21 reactors not in column one of the Action Matrix. Some might ask why the Tennessee Valley Authority has three nuclear plants—Browns Ferry, Sequoyah, and Watts Bar—in the Degraded Cornerstone Column (column three). The answer would be that TVA only operates three nuclear plants. All six of TVA’s reactors have performance problems that moved them out of column one. Whether one believes in nature or nuture, when all six children receive troubling report cards, one has to question the role of the parents.
The UCS Nuclear Energy Activist Toolkit (NEAT) is a series of post intended to help citizens understand nuclear technology and the Nuclear Regulatory Commission’s processes for overseeing nuclear plant safety.


