
This post is from 2018. Since then we’ve posted more information online that addresses issues of population growth, climate change, and food security.
Recently I was looking at some data about world food production on the excellent Our World in Data site, and I discovered something very simple, but very surprising about the world’s population. We often hear (and I used to teach) about the threat of an exponentially growing population and the pressure it is supposed to be putting on our food supply and the natural resources that sustain it (land, water, nutrients, etc). But I found that the global population isn’t growing exponentially, and hasn’t been for at least half a century.
It has actually been growing in a simpler way than exponentially—in a straight line.
What exponential growth is
Exponential growth (sometimes also called geometric or compound-interest growth) can be described by an equation in which time is raised to a power, i.e. has an exponent—hence the name. But it also can be described in simpler terms: the growth rate of the population, as a fraction of the population’s size, is a constant. Thus, if a population has a growth rate of 2%, and it remains 2% as the population gets bigger, it’s growing exponentially. And there’s nothing magic about the 2; it’s growing exponentially whether that growth rate is 2% or 10% or 0.5% or 0.01%.
Another way to put it is that the doubling time of the population—the number of years it takes to grow to twice its initial size—is also a constant. So, if the population will double in the next 36 years, and double again in the following 36 years, and so on, then it’s growing exponentially. There’s even a simple rule-of-thumb relationship between doubling time and the percentage growth rate: Doubling Time = 72/(Percentage Growth Rate). So that population with a 36 year doubling time, is growing at a rate of 2% per year.
But probably the simplest way to describe exponential growth is with a graph, so here’s how it looks:
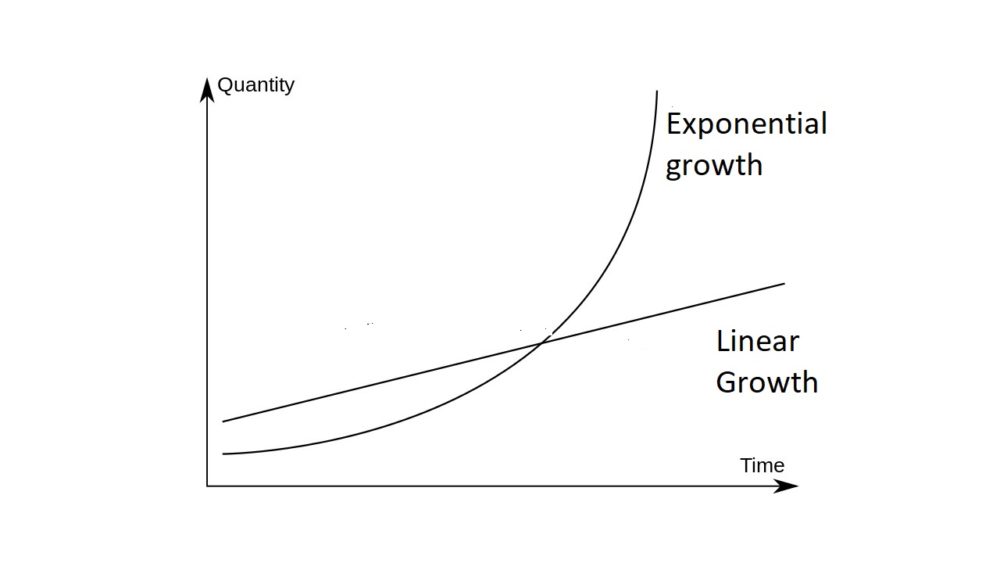
Figure 1. Exponential growth versus linear (straight-line) growth.
This graphic not only shows the classic upward-curving shape of the exponential growth curve, but also how it contrasts with growth that is linear, i.e. in a straight line. Additionally, it demonstrates a simple mathematical result: if one quantity is growing exponentially and a second quantity is growing linearly, the first quantity will eventually become larger than the second, no matter what their specific starting points or rates of growth.
This isn’t just abstract math; it also illustrates the most famous use of exponential growth in political debate. It was put forward by the English parson Robert Malthus over two centuries ago. He argued that the human population grows exponentially while food production can only grow linearly. Thus, it follows inevitably that the population will eventually outgrow the food supply, resulting in mass starvation. This is the case even if the food supply is initially abundant and growing rapidly (but linearly). The upward-bending-curve of an exponentially-growing population will always overtake it sooner or later, resulting in catastrophe.
Looking at real data
Critics ever since Malthus’ time have pointed out that his assumption that food production grows in a straight line is just that—an assumption, with little basis in theory. So I wasn’t surprised to see that the OWID data showed faster-than-linear (upward-curving) growth in global food production over the past half-century. What did surprise me was that the growth of the world’s population over that time period has actually been very close to a straight line.
Here’s that graph:

Figure 2. World population growth from 1961 to 2016, from the official U.N. figures. The data are expressed as an index, with the 1961 population = 100. To convert the index to actual numbers of people, just multiply the index value by 30,830,000, since the world population in 1961 was 3.083 billion.
The graph looks very much like a straight line rather than the upward-curving exponential, but is that really the case? We can test this by calculating the value of what statisticians call the R2 (or “coefficient of determination”) for this curve. The closer it is to a straight line, the higher R2 will be, and if the data fits a straight line perfectly then R2 will be exactly 1.0.
So, what’s the actual value for this data? It’s 0.9992. I.e. the fit to a straight line isn’t quite perfect, but it’s very, very close.
Is this some sort of artifact?
I was actually quite surprised at how well the data fit a straight line—so much so that I wondered if this was just an artifact of the method I used, rather than a real result. So I applied the same method—plot the data, fit a straight line to it, and calculate the value of R2—to the data for some of the world’s largest countries and regions, rather than the world as a whole.
For several of these, the lines looked very straight and the value of R2 was almost as high as in the graph for the world as a whole, or even slightly higher, e.g.:
| Country or Region | R2 for the linear equation of Population vs. Time |
| Brazil | .9977 |
| India | .9954 |
| Indonesia | .9995 |
| Latin America and the Caribbean | .9994 |
| North America | .9966 |
| Pacific island small states | .9991 |
But for others it was considerably lower (e.g. .9777 for China, .9668 for the European Union) and two graphs proved clearly that the excellent fit to a straight line is a real result, not an artifact. These were the ones for Sub-Saharan Africa and Russia:
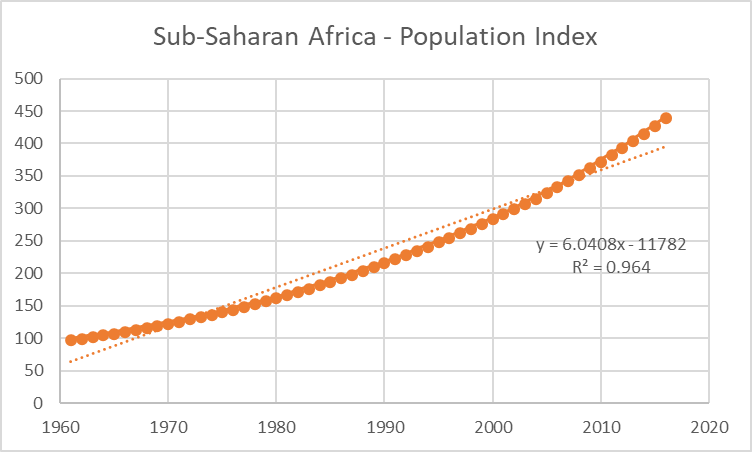
Figure 3. Population growth of Sub-Saharan Africa from 1961 to 2016, from the official U.N. figures available at ourworldindata.org. The data are expressed as an index, with the 1961 population = 100. Thin dotted line shows the best-fit straight line; thick dots show the actual data.
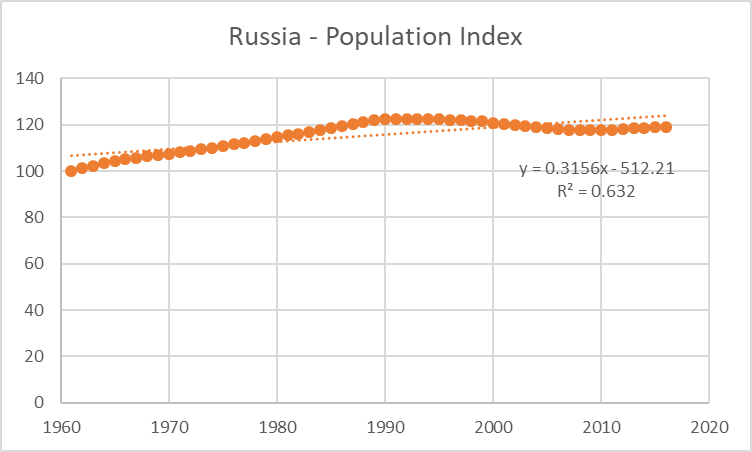
Figure 3. Population growth of Russia from 1961 to 2016, from the official U.N. figures available at ourworldindata.org. The data are expressed as an index, with the 1961 population = 100. Thin dotted line shows the best-fit straight line; thick dots show the actual data.
The point about the Sub-Saharan African graph is not simply that it has a lower value of R2 (0.964), but that its data deviates from the straight line in the way that an exponential curve should: higher than the straight line at the lowest and the highest time values, and lower than the straight line at the intermediate ones. It does fit an exponential curve quite well, thus showing that the method can pick out an exponential curve if the data do follow one. But this is the only region or large country for which that’s actually true.
The Russia graph doesn’t fit an exponential curve well at all—it actually curves downward overall, rather than upward as it should if it were an exponential—but it does show that the value of R2 can be much lower than 1.0 for real data. For Russia it’s 0.632. So as with the Sub-Saharan Africa case, it proves that the high value of R2 for the world as a whole is not an artifact caused by the method. It reflects the reality of the past 55 years.
Finally, since I and many of my readers are from the United States, here’s that graph:

For the US as for the whole world, population growth over the past half-century has been quite close to a straight line; the R2 is 0.9956.
A direct test of whether growth is exponential
These graphs and R2 values seem to indicate that linear growth is the best model for the world population over the past 55 years, but there’s another way to show that it’s not exponential. As I said above, exponential growth occurs when the percentage growth rate remains constant as the population gets bigger. So a simple test is to graph the percentage growth rate over time, and see whether it’s a constant—i.e., a horizontal line. So here’s that graph:

Figure 6. Percentage growth rate of the world population from 1961 to 2016, calculated from the official U.N. figures available at ourworldindata.org. The trend lines goes downward over time, rather than being horizontal as it would if the percentage were a constant.
This result, like the others, is quite clear. The percentage growth rate is not a constant, as it should be if the population were growing exponentially. Rather, it has been dropping steadily over the past half-century, from over 2.0% in the early sixties to below 1.2% now.
What exponential growth is Not
So, we should stop saying that the world’s population is growing exponentially. That hasn’t been the case for at least 50 years. Exponential growth clearly doesn’t describe the global reality of the twenty-first century.
But there’s actually a second reason to stop saying that the global population is growing exponentially, and that’s because the term is so commonly misused and misunderstood. Note the next few times that you hear someone use the word, and I think you’ll find that it’s not being used in the sense of “constant percentage-growth-rate” or “constant doubling-time” or even just “an upward-bending curve.” Rather, it’s being used—often with an emphatic stress on the “-nen-” syllable and an implicit exclamation mark at the end of the phrase—to mean “rapidly” or “quickly” or “fast” or “big.”
That way of speaking is common, but it’s also just plain wrong. Remember the example that I started with: the exponential growth rate can be high (e.g. 10%) or low (e.g. 0.01%) or intermediate (e.g. 2%). In every case it’s exponential growth, but it’s very fast exponential growth if the growth rate is 10% and very slow exponential growth if it’s 0.01%.
I’m not that sanguine about getting people to go back to using “exponential” in its correct sense, but I think it’s at least worth a try. After all, we already have several other good words for that other, incorrect meaning—e.g. “fast” or “big.”
Implications
The results don’t just imply that we should talk about population growth differently, but also that we need to re-think how it relates to food production. There is good news in these data, because they show that hunger and environmental catastrophe is not at all inevitable. Malthus’ argument just doesn’t fit reality.
While linear growth has its challenges, it’s far easier to deal with than exponential growth. The distinction between growing exponentially and growing in a straight line does matter. On that point, at least, Malthus got it right.