

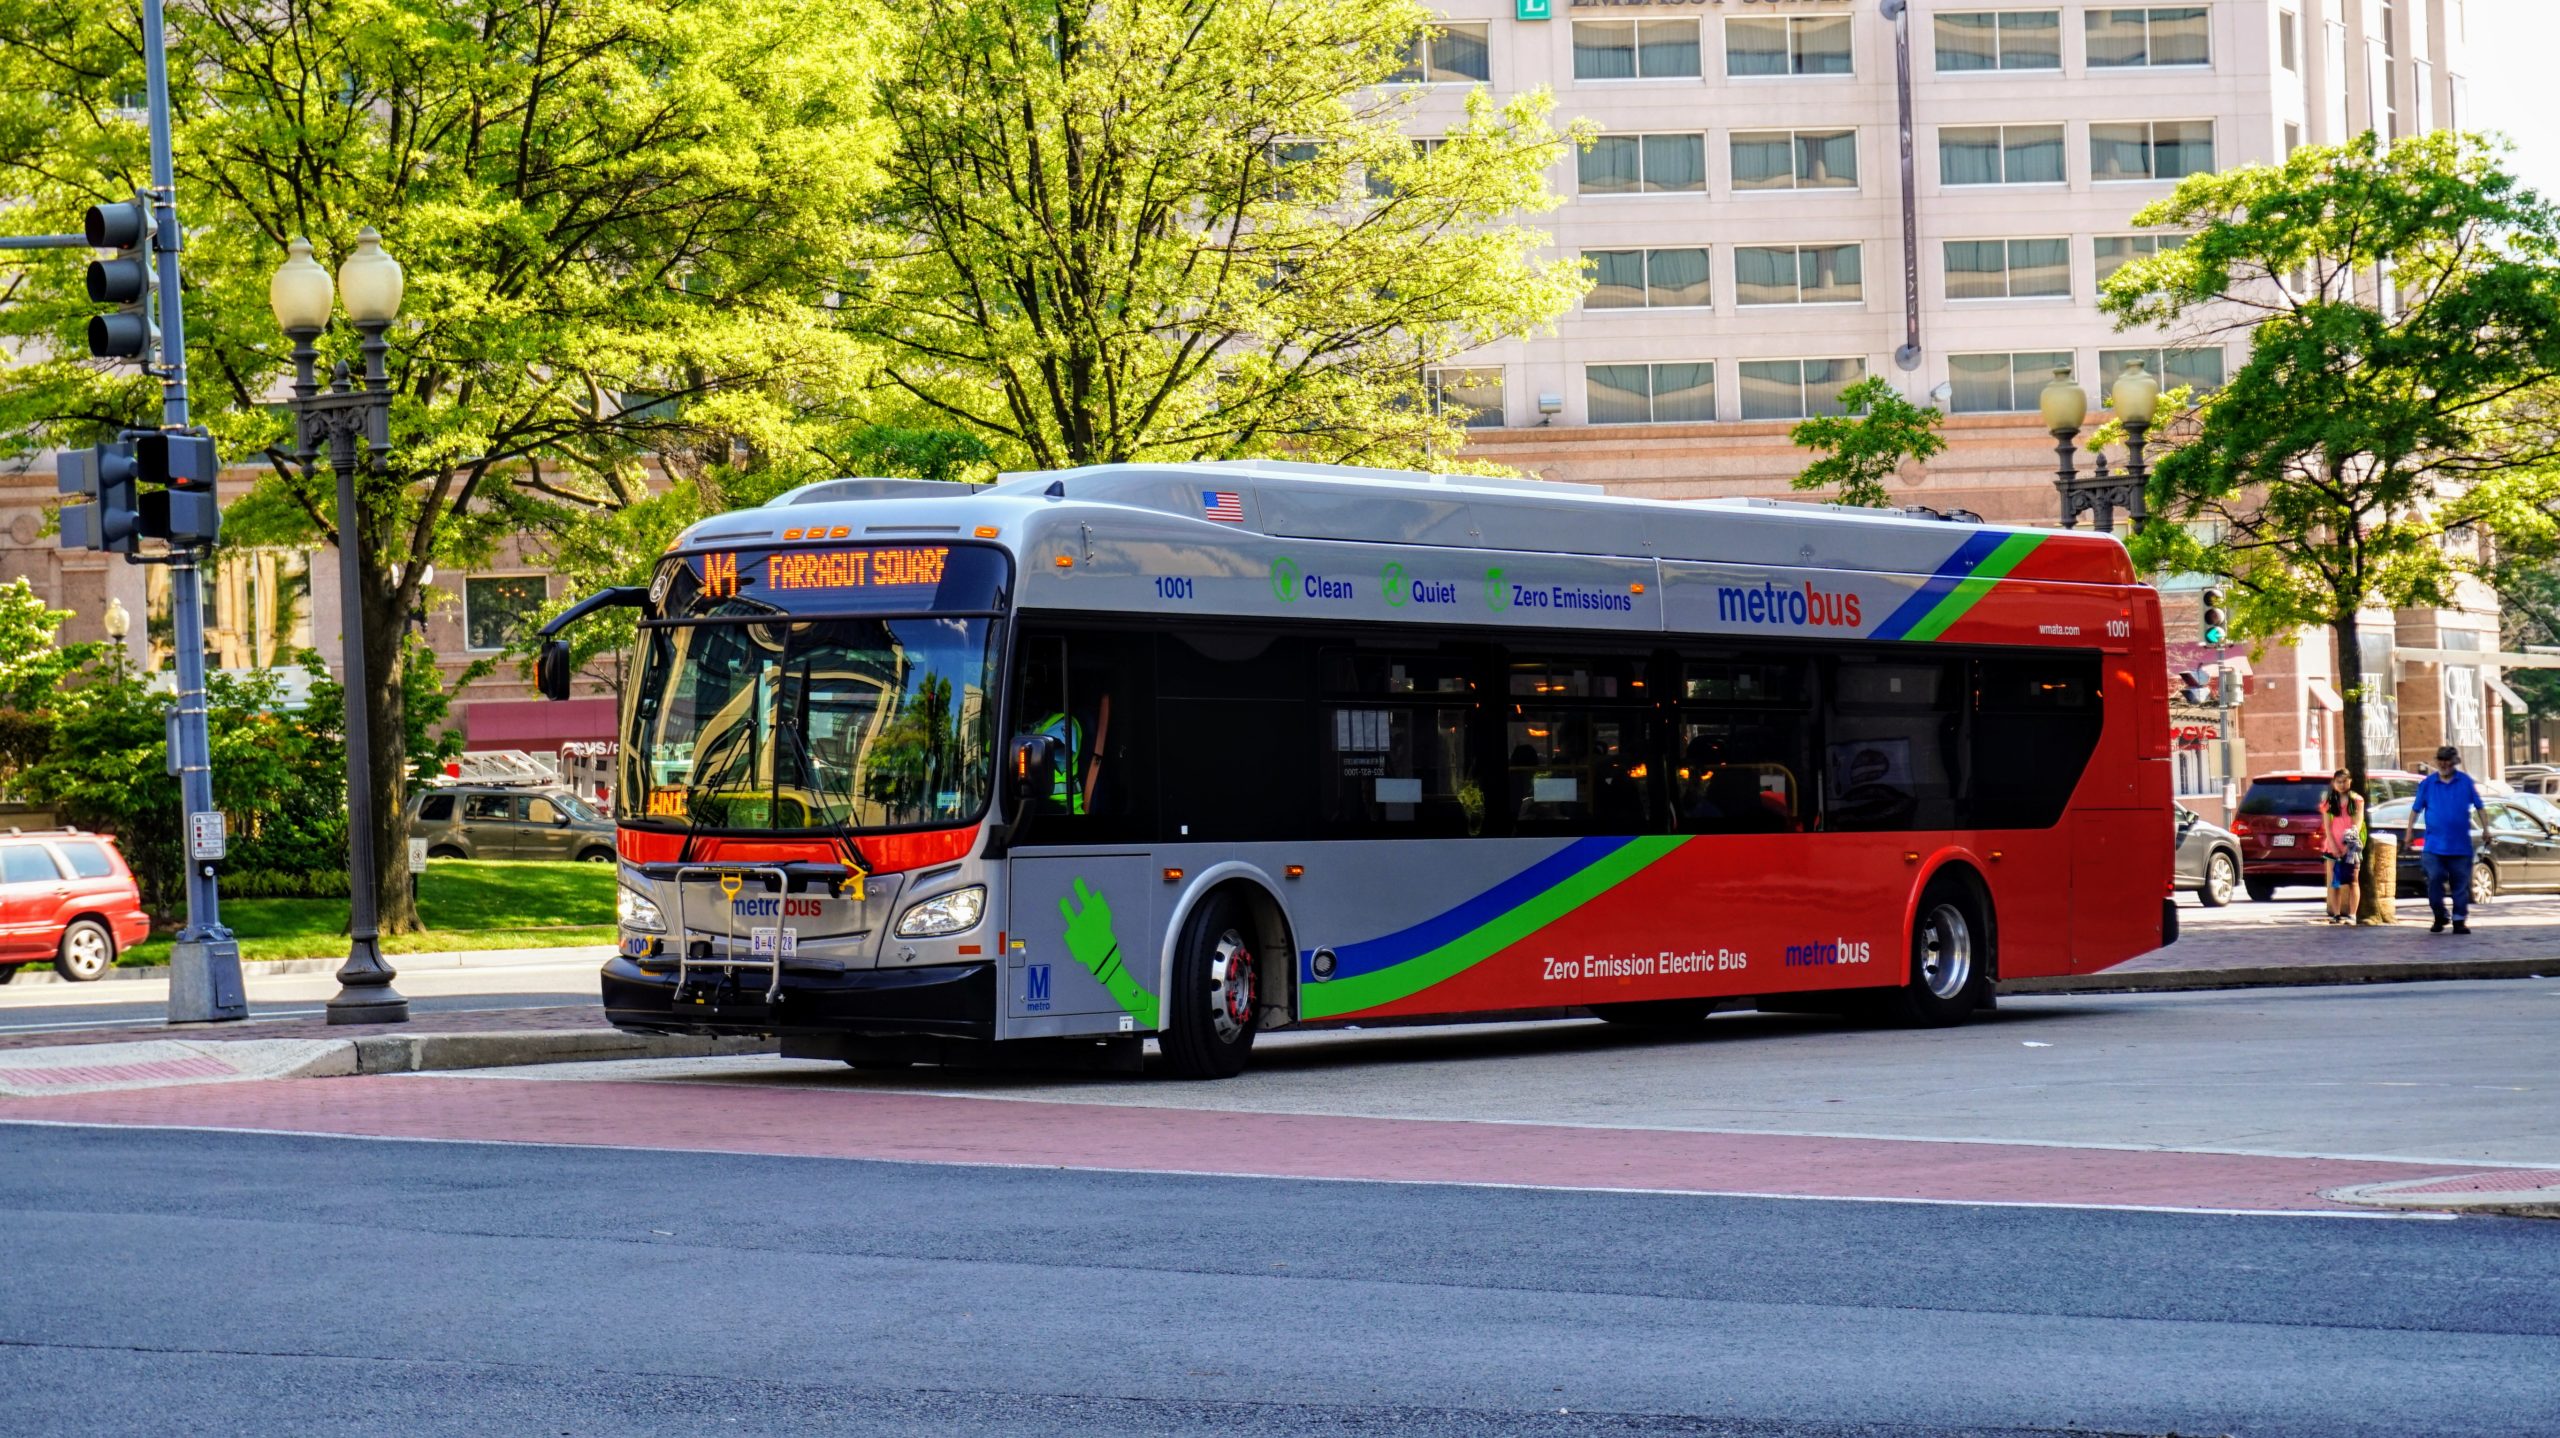
Battery electric buses – the people’s electric vehicle – are becoming more and more common. An increasing number of transit agencies – large and small – are making announcements about purchasing electric buses and putting them into operation.
The obvious benefit of electric buses is that they don’t have any tailpipe emissions. A question we often get at UCS is, “What about emissions used to generate electricity for electric vehicles?”
We answered this for buses charged on California’s grid and found that battery electric buses had 70 percent lower global warming emissions than a diesel or natural gas bus (it’s gotten even better since that analysis). So what about the rest of the country?
You many have seen my colleagues’ work answering this question for cars. We performed a similar life cycle analysis for buses and found that battery electric buses have lower global warming emissions than diesel and natural gas buses everywhere in the country.
What the map shows
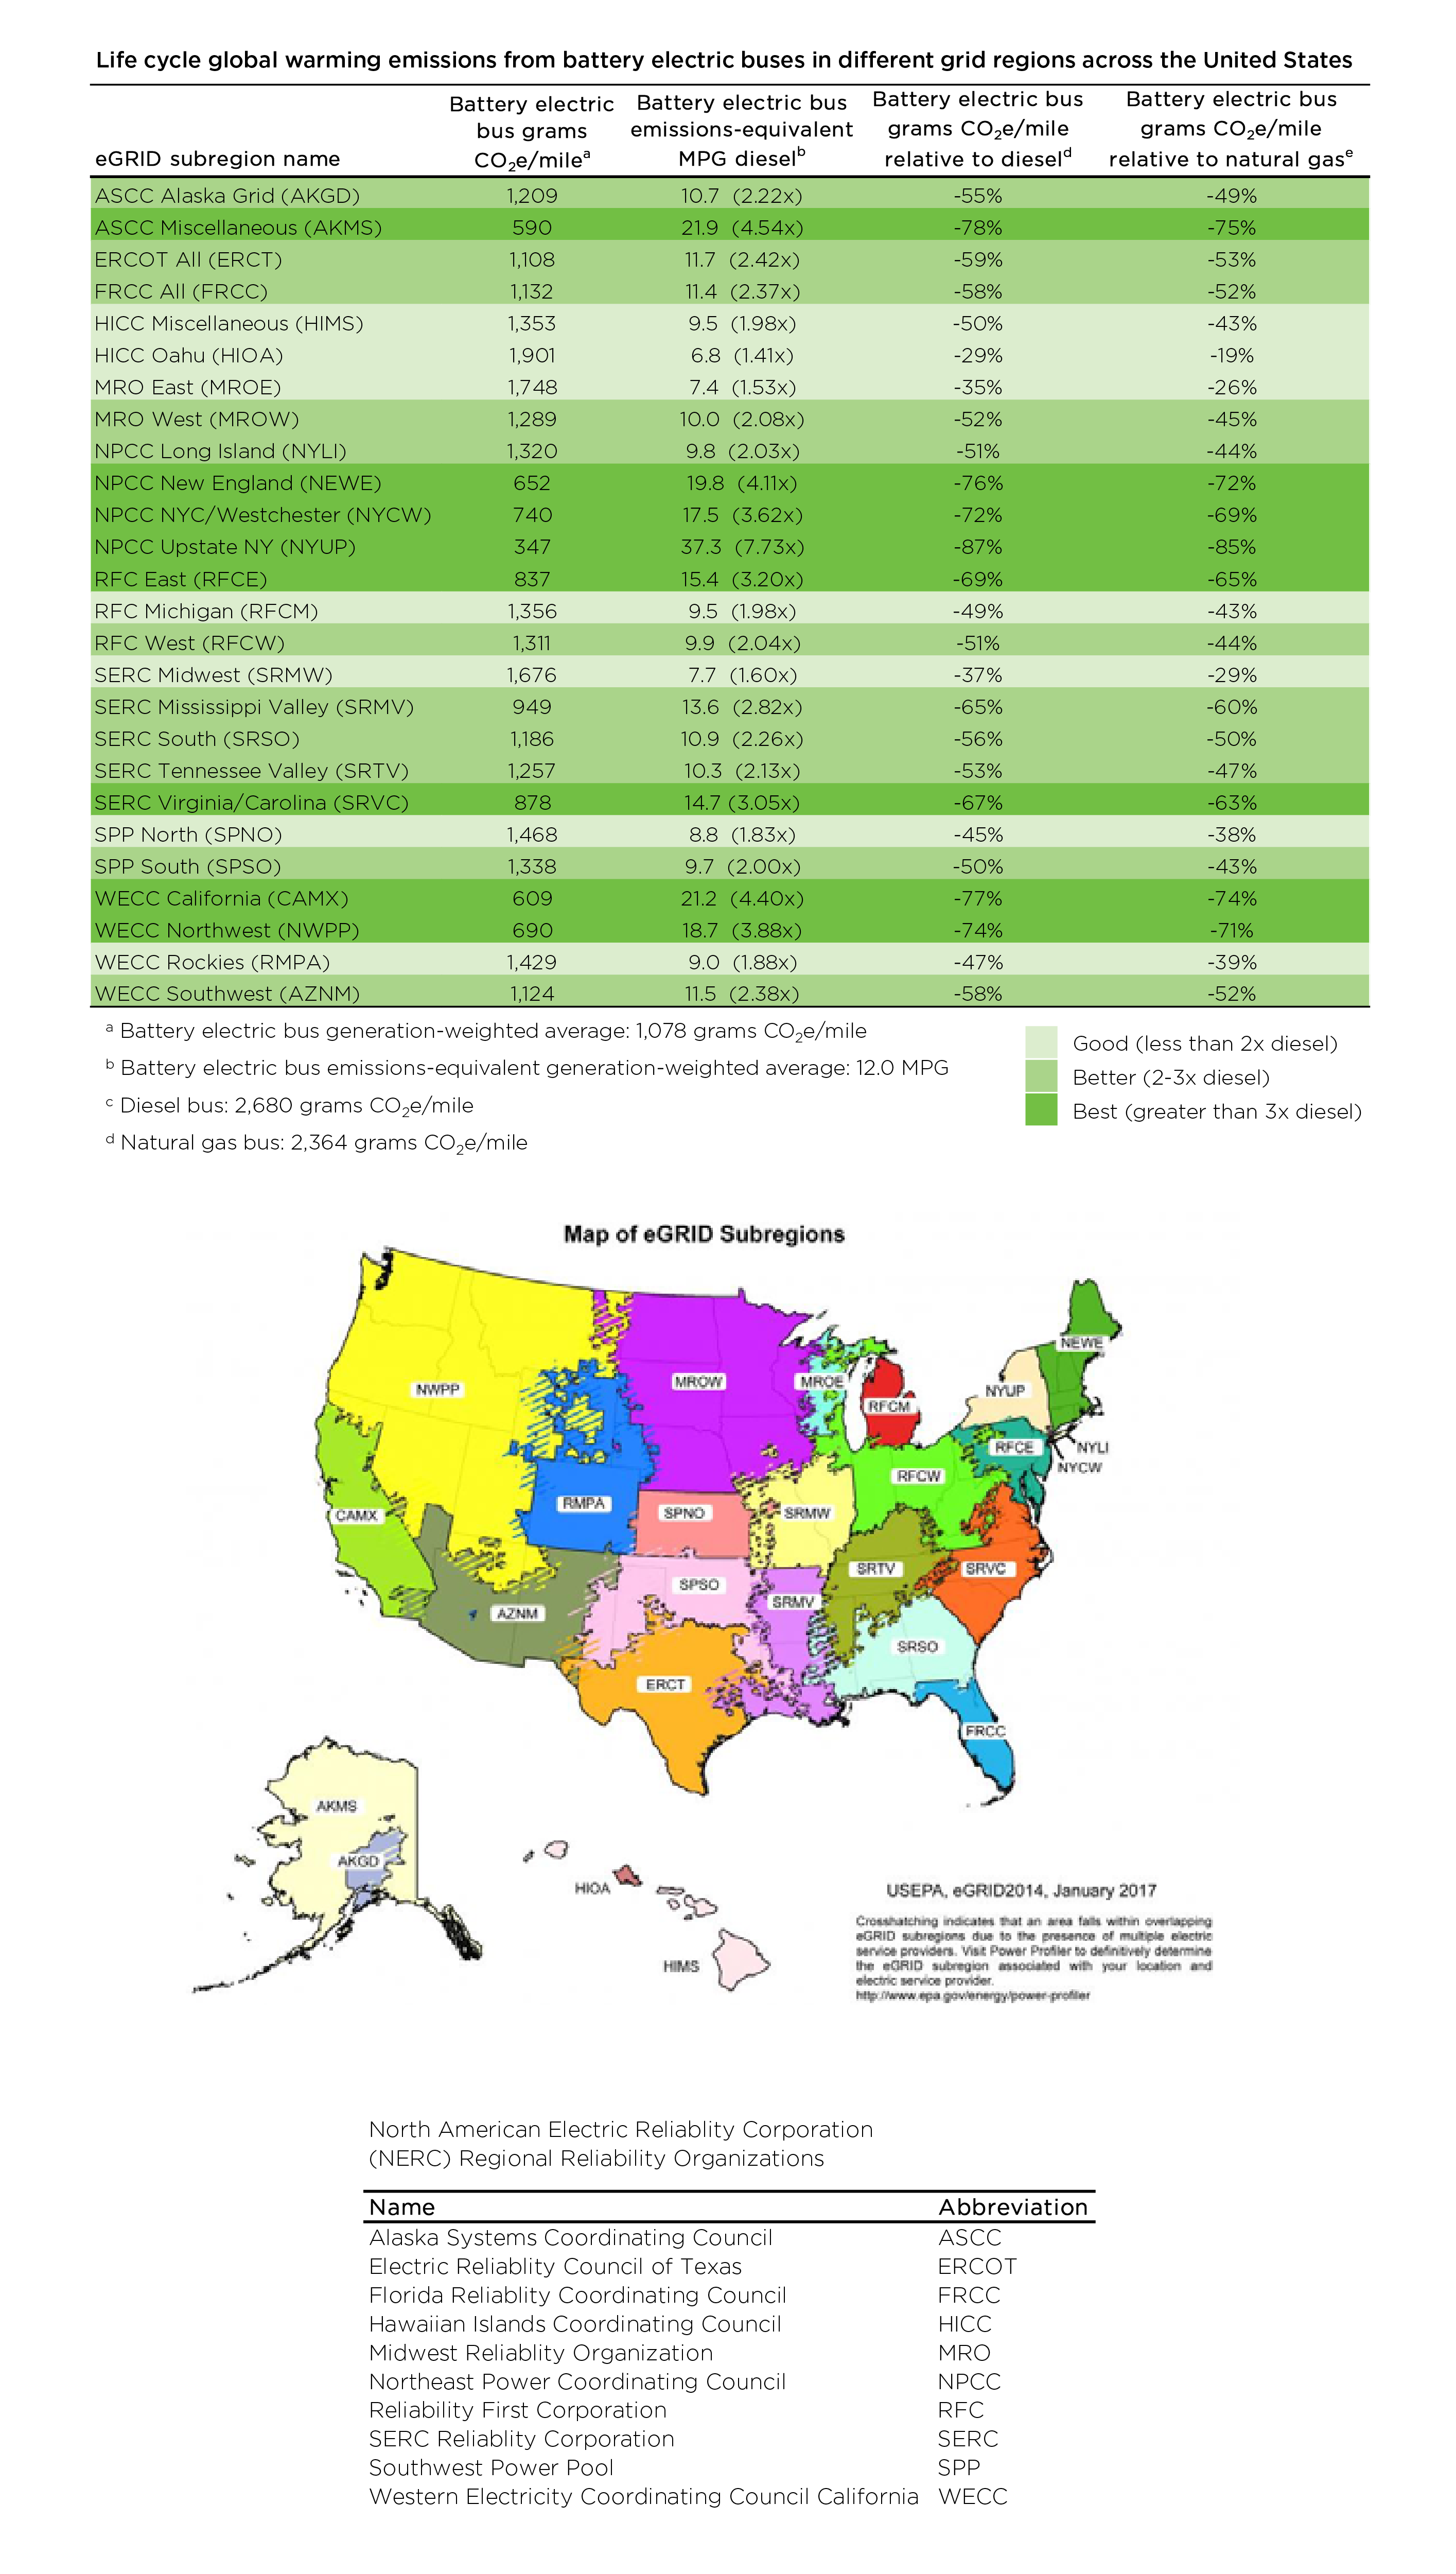
The map above shows the miles per gallon that a diesel bus would need to have equivalent life cycle global warming emissions as a battery electric bus on today’s grid (really the 2016 grid, the most recent data available).
This means a battery electric bus operated in North Carolina, for example, has the same life cycle global warming emissions as a diesel bus that gets nearly 15 miles per gallon! That’s impressive considering a comparable diesel bus actually gets 4.8 miles per gallon. So, you can operate three electric buses in North Carolina and have the same emissions as a single diesel bus.
Electric buses are better for the climate than diesel buses everywhere in the country
Battery electric buses range from 1.4 to 7.7 times better than a diesel bus, as shown in miles per gallon emissions-equivalency. Another way of saying this is that a diesel bus has nearly 1½ to 8 times the global warming emissions as an electric bus, depending on the region.
And the grid is getting cleaner every year. Emission rates from electricity have steadily declined the last sixteen years. Transit agencies can also choose cleaner power than what’s provided on their grids by installing solar panels and batteries on site or through renewable electricity contracts.
Charged with the national electricity mix, a battery electric bus has global warming emissions equivalent to a diesel bus getting 12 miles per gallon. This is 2.5 times better than an actual diesel bus (4.8 miles per gallon).
They’re also better than natural gas and diesel-hybrid buses
Everywhere in the country, battery electric buses also have lower life cycle global warming emissions than natural gas and diesel-hybrid buses. Charged with the national electricity mix, an electric bus produces 1,078 grams CO2e per mile, while a natural gas bus produces 2,364 grams CO2e per mile and a diesel-hybrid produces 2,212 grams CO2e per mile.
(Note, values for CO2e per mile reflect the same analysis as the miles per gallon emissions-equivalent values shown in the map, just presented in different units).

Natural gas buses have 12 percent lower global warming emissions than diesel buses.* Electric bus emissions range from 29 to 87 percent lower than diesel buses and 19 to 85 percent lower than natural gas buses.
Here’s a table showing the life cycle global warming emissions per mile from electric buses in all regions of the US.
Click to enlarge
Cleaner electricity means cleaner electric buses
In upstate New York, the region with the lowest carbon grid in the country (roughly 30 percent hydropower, 30 percent nuclear, 30 percent natural gas), a battery electric bus has nearly 90 percent lower global warming emissions than a diesel bus.
A battery electric bus charged in upstate New York even has lower life cycle emissions than the average passenger vehicle on the road (new and old combined)! An electric bus charged there produces about 350 grams carbon dioxide equivalents (CO2e) per mile, while the average gasoline car/SUV in the US is responsible for 500 grams CO2e per mile.**
Other grid regions (California, Alaska, New England, and the Pacific Northwest) aren’t too far off at about 650 grams CO2e per mile, without even accounting for the fact that a bus can carry a lot more people than a car.
The time is right to get more electric buses on the road
With zero-tailpipe emissions and low life cycle global warming emissions, battery electric transit buses offer significant local air quality and climate benefits. The more of these buses that are deployed the better. Encourage your local transit agency to begin exploring electric buses, if they haven’t already. Also encourage your state and federal representatives to provide incentive funding to help get these clean vehicles on the road.
Methods
Life cycle emission data and models
Life cycle global warming emissions for battery electric buses include those from generating electricity and extracting, processing, and transporting the fuels used to generate electricity. These emissions were compared to the life cycle emissions of diesel and natural gas buses, which include tailpipe emissions and emissions from extracting, refining, and transporting the oil and natural gas.
Emissions from electricity generation are from the US Environmental Protection Agency’s eGRID 2016 database, reflecting emissions from calendar year 2016. Emission rates include transmission losses associated with delivering electricity, roughly 5 percent, depending on the region.
Emissions from extracting, processing, and transporting the fuels used to generate electricity, diesel, and natural gas were determined using Argonne National Laboratory’s GREET 2017 model. This model was also used to determine the tailpipe emissions from diesel and natural gas vehicles.
Methane emissions and global warming potential
Life cycle emissions from natural gas vehicles depend greatly on the extent of methane leaks throughout the fuel’s life cycle and the global warming potential used for methane. Our analysis uses conservative estimates for both, including global warming potentials over a 100-year period from the IPCC’s 5th Assessment Report. Using higher, yet justifiable, assumptions for methane leaks and its global warming potential, the global warming emissions of natural gas buses can change from 12 percent less than diesel (as used in this study) to 20 percent greater than diesel.
Fuel efficiency
The bus manufacturer New Flyer makes the same bus (40-foot Xcelsior) in diesel, diesel-hybrid, natural gas, and battery electric versions. These buses have undergone testing by the Federal Transit Agency, allowing for comparison of fuel efficiencies across vehicle type and over the same test conditions.
Fuel efficiencies used in this analysis were as follows: diesel bus: 4.82 miles per diesel gallon; diesel-hybrid bus: 5.84 miles per diesel gallon; natural gas bus: 4.47 miles per diesel gallon equivalent; and battery electric bus: 2.02 kWh per mile, which accounts for a 90 percent charging efficiency.
The on-road fuel efficiency of any bus will depend on the specific route, including the vehicle’s speed, number of stops, and terrain; passenger load; auxiliary uses of energy, e.g. air conditioners or heaters; and the inherent efficiency of the engine or electric motor, which varies by manufacturer.
Standardized testing of the New Flyer buses shows that electric buses are four times more energy efficient than natural gas buses. In contrast, a study of electric and natural gas buses operated on the same routes by Foothill Transit in Southern California showed electric buses had eight times better fuel efficiency.
Note, converting the fuel efficiency of the electric bus (i.e., 2.02 kWh per mile) into an equivalent miles per diesel gallon (using the amount of energy contained in a gallon of diesel, 129,488 British thermal units per gallon), gives an equivalent fuel efficiency of the battery electric bus of 18.8 miles per diesel gallon equivalent.
Comparing this fuel efficiency to a diesel bus reflects only how much energy the two vehicles use over the course of a mile. The MPG numbers shown in the map above go several steps further and include upstream emissions, which is why we refer to them as “the equivalent life cycle global warming emissions from a diesel bus with X miles per gallon efficiency.” A mouthful, but a critical distinction.
Fuel efficiency is representative of global warming emissions if you’re talking about the same type of vehicle using the same type of fuel, e.g., comparing a diesel bus made by company X to a diesel bus made by company Y. But, if you want to compare two different types of vehicles, e.g. a battery electric bus and a diesel bus, the upstream emissions associated with the fuel or electricity production need to be accounted for, as reflected in the values on the map.
* This result is similar to the finding that natural gas buses have just 9 percent lower global warming emissions than diesel buses in our previous analysis, which was specific to California.
** This result makes use of our life cycle emissions analysis for passenger vehicles and the average fuel efficiency of these vehicles on the road.