Autumn is a time of shorter days and longer nights (and less sun), but it is also when the annual reports on US progress on solar energy come out from Lawrence Berkeley National Laboratory (LBNL). And the recent one on advances in systems for homes, businesses, and institutions has plenty to sink your teeth into while munching on an apple cider donut.
The new Tracking the Sun report from LBNL covers solar photovoltaic (PV) systems for the “grid-connected, distributed” piece of the solar story for both residential and “non-residential” up to a certain size.
The report charts continued progress in several important categories in 2021, including PV module efficiency, system costs, and the prevalence of batteries, which are a more and more important piece of the solar picture.
PV modules keep getting more efficient
One finding is that the efficiency of PV modules keep climbing. Median values for modules in residential systems rose from 13.6 percent for systems installed in 2002 to 20.1 percent in 2021—that’s a 48 percent increase, much of it in the last decade. Non-residential systems showed similar increases.
Part of that progress is due to the increasing dominance of more-efficient mono-crystalline technologies (the ones with smooth-looking single-crystal cells). For residential systems, their share rose from 41 percent in 2016 to 98 percent in 2021. LBNL also mentions the increasing use of passivated emitter rear-cell technology, or PERC.

Note that those figures are median efficiencies; modules are actually available with efficiencies considerably higher. The (non-PERC) ones on my own roof, for example, are 22 percent efficient.
Solar keeps getting cheaper
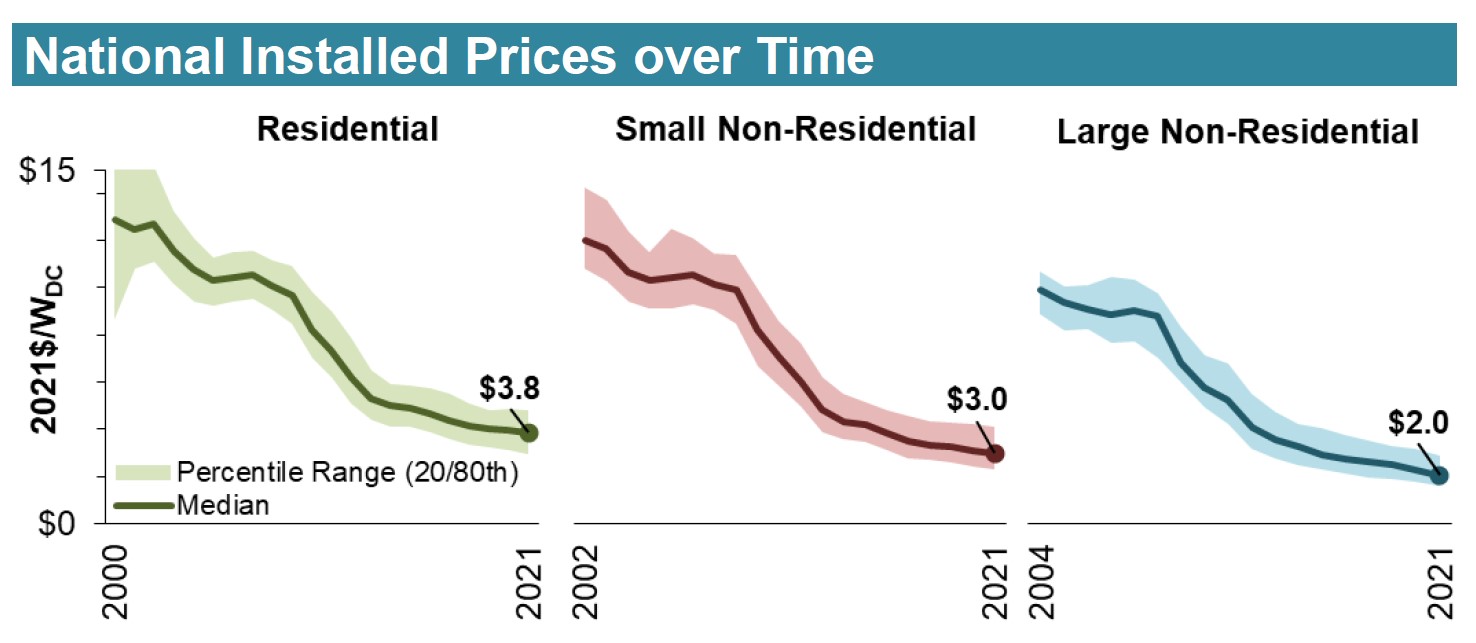
A second takeaway is that impressive price drops have continued for the systems included in LBNL’s analysis. For residential systems, they found that median prices per watt fell 63 percent from 2007 to 2021. And for small and large non-residential systems, the price drops were even more pronounced: 72 and 77 percent, respectively. LBNL found additional drops from 2020 to 2021 of 3.4, 3.9, and 11 percent for residential, small non-residential, and large non-residential systems, respectively.

While earlier price drops came largely from reductions in the cost of PV modules, progress in recent years has come from improvements in what LBNL calls “residual BOS+soft costs” categories. The BOS, or balance of system, is the equipment other than the module and the inverter, the piece that converts the DC power from the modules to AC for the home and the electricity grid. These soft costs include all the other things that go into making a system happen, such as permitting and installation.
PV systems are getting larger
The lower prices and higher efficiencies have helped fuel another trend revealed in LBNL’s data: residential systems are getting larger. The median size in 2021 was 7 kilowatts, up 39 percent from a decade before.

To be clear, all this doesn’t mean that systems need to get larger—just that maybe they can. A 5-kilowatt system, the standard for a home system not long ago, still produces just as much as a 5-kilowatt system used to. A system that size just might be that much cheaper. But the price drops also mean that a given solar budget can likely get you more solar.
Economies of scale also come into play: for residential systems, LBNL found that an 8-to-9 kilowatt system in 2018 was on average 13 percent cheaper per watt than a 4-to-5 kilowatt one.
And the higher efficiencies mean that a given roof area can fit that much more. (I know: I maxed out my roof area squeezing every kilowatt of solar I could up there.)
Energy storage comes on strong
As for resilience: solar modules have been plenty strong for years. Even early in my solar career manufacturers would say their products would withstand one-inch hailstones. And the warranties for most panels lengthened to 25 years a while back.
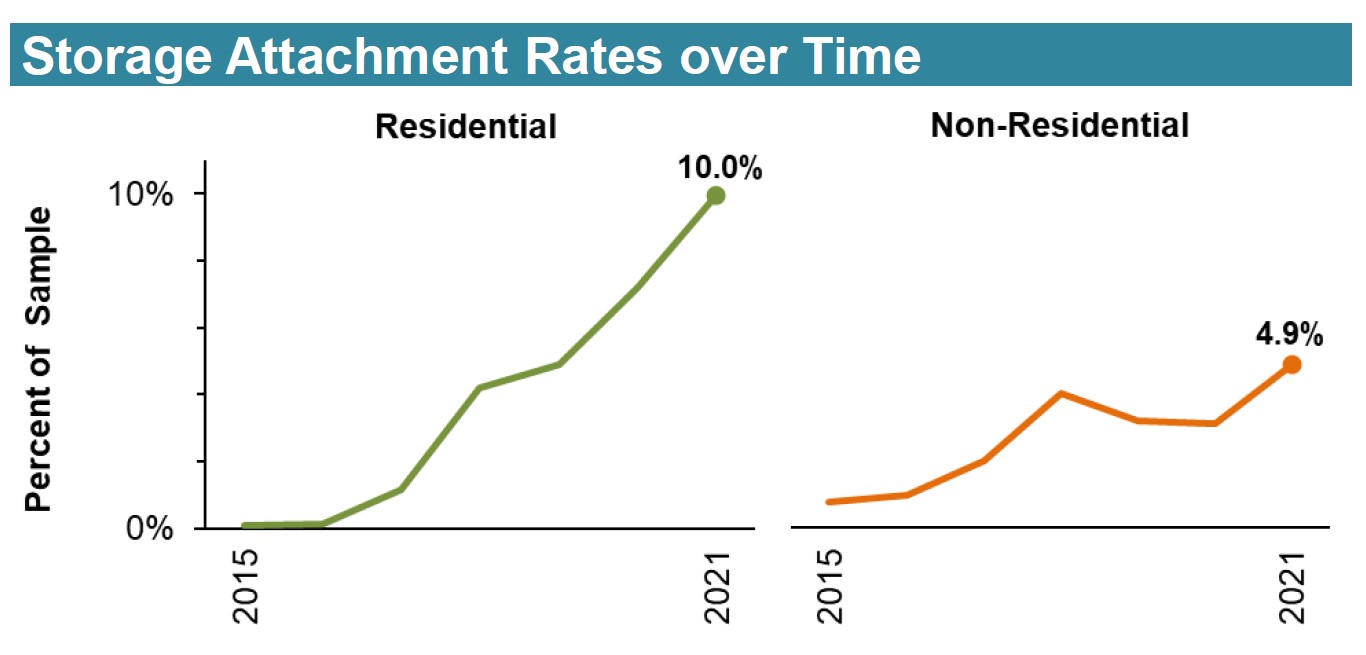
What’s different now is the prevalence of energy storage that can make the systems themselves more resilient. From 2016 to 2021 storage leapt from 0.1 to 10 percent for residential systems in LBNL’s sample, and from 1 to 4.9 percent for non-residential.

Hawaii leads the pack in adoption, with storage included in 93 percent of residential installations and 59 percent of non-residential, because of strong incentives for self-consumption (using your own solar production for your own needs). California leads for overall numbers of systems with storage; the Golden State has storage on 11 percent of residential systems and 5 percent of non-residential—driven, says LBNL, by the state’s energy storage rebates and “resilience concerns” (think extreme weather and blackouts). And Texas was notable for its increase in interest in storage after its severe February 2021 winter storm.
Much more to come
The latest report covers just a piece of what’s happening in solar; LBNL reports on large-scale systems elsewhere. And it focuses on the technology and the economics, not on, say, who solar is reaching.
But the happenings in the residential, commercial, and institutional market segments are really important for our vital move to clean energy. And there’s a lot more solar activity underway and on its way—especially with the new federal Inflation Reduction Act’s 10-year extension of the tax credits that have been so powerful for driving renewable energy, including solar.
With higher efficiencies, lower prices, and more resilience, solar just keeps getting better.

