2024 is another year of new extremes in climate: this year’s summer was the hottest on record. In particular, July 22 will be remembered as the hottest day recorded, when the global average temperature hit 62.9°F according to the Copernicus Climate Change Service. Heat waves, floods, storms, and wildfires are breaking records and impacted nearly everyone in the United States and its Caribbean territories.
As we have been doing since 2022, this year we tracked alerts issued by the National Weather Service (NWS) for these extreme weather events during Danger Season—the period between May and October when climate change increases the frequency and magnitude of extreme weather events. By mid-August everyone in the US lived in a county that had experienced at least one of these events.
We saw that climate change is driving a longer Danger Season that affects everyone in the US. That means that the work of key federal agencies such as the National Oceanic and Atmospheric Administration (NOAA) and National Weather Service (NWS) is more critical than ever. They must be allowed to continue providing accurate and timely forecasts of extreme weather events because these forecasts save American lives.
According to a proposed policy framework for the Trump Administration, NOAA and other federal agencies will be gutted, leaving us with little protection against the more intense and more frequent extreme weather we experienced this danger season and will continue to experience as global temperatures rise.
In recent years, Danger Season has ended in October, but in yet another sign of worsening climate change, the Northeast is still facing fire weather amid summer temperatures in November. Here’s what it has brought so far.
Heat
The 2024 Danger Season opened in late May with a nearly week-long heat wave in southern Texas during Memorial Day weekend, when millions in the US kick off the summer. The border cities of Brownsville and McAllen set daily records at 100°F and 102°F, respectively, while Del Río broke its own monthly record of 109°F, then a few days later it broke that record when temperatures hit 112°F.
June 19 marked the first-ever excessive heat wave on record for northeast Maine in a nearly nine-day heat wave that stretched from Ohio to the mid-Atlantic. Impacts were expected on transportation infrastructure, as Amtrak warned travelers they may experience delays as trains need to run at slower speeds when tracks get too hot.
On July 8, the Third Avenue bridge that connects the Bronx and Manhattan in New York City was stuck in the open position because the high temperatures expanded the steel, prompting city crews to hose down the bridge with water to cool it down.
From June 27 to July 14, heat wave conditions persisted along the West Coast and Pacific Northwest. In Death Valley National Park, temperatures of 128°F grounded rescue helicopters that could not safely fly to rescue motorcyclists affected by heat. And in Washington state, triple-digit temperatures expanded the asphalt along a county highway, causing delays and emergency road repairs.
However, these reports do not reveal the profound inequities in who is most exposed to climate impacts. I combined data from our Danger Season tracker with population disadvantage data to assess inequities in population exposure. I found a few concerning things.
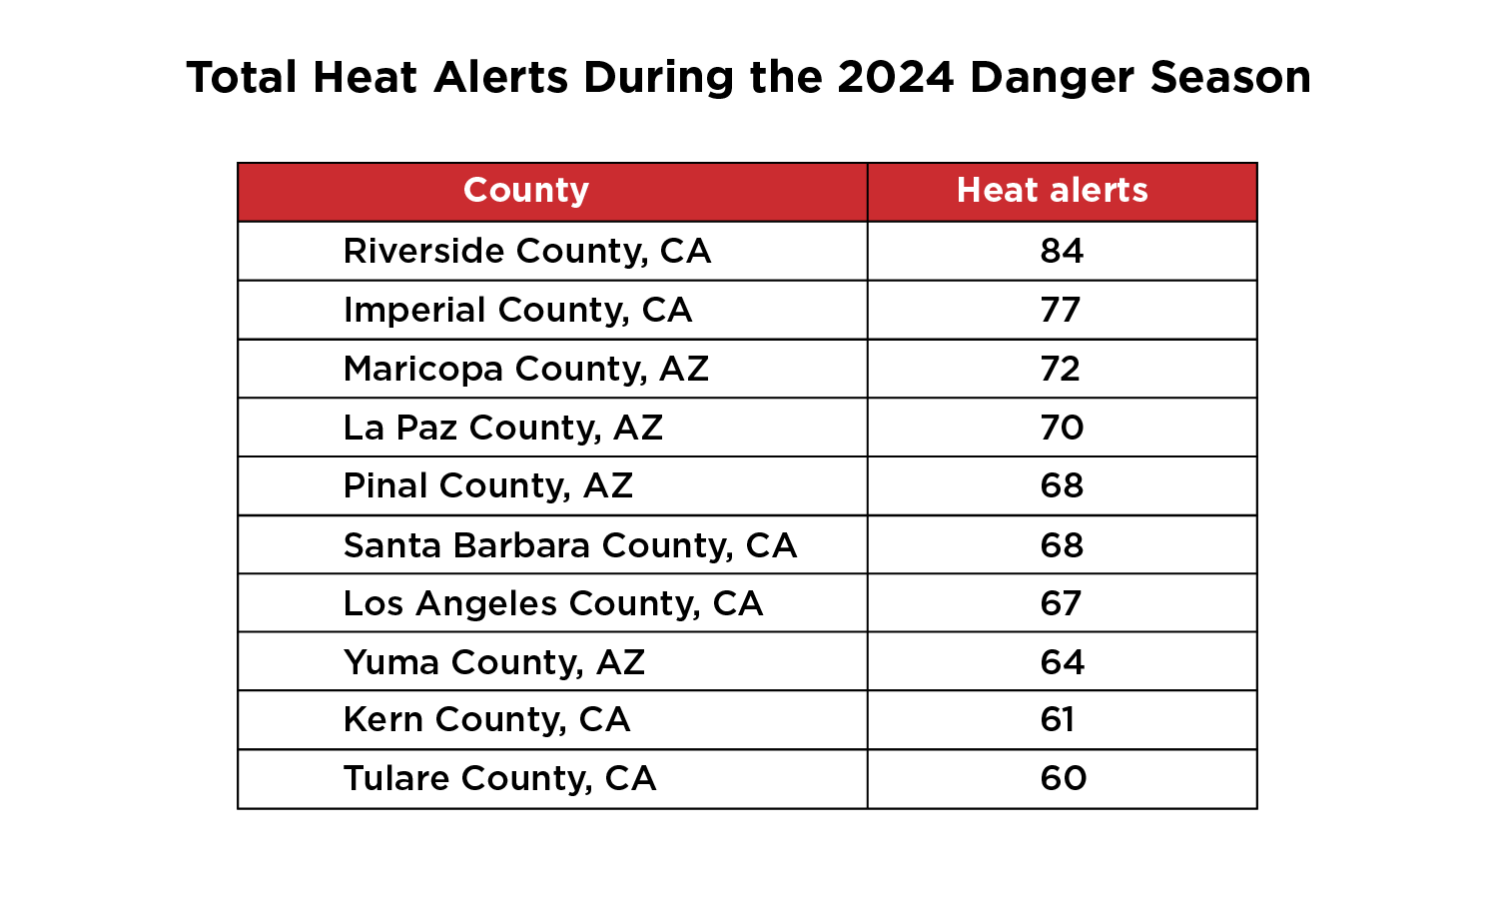
While counties with at least 25 percent disadvantaged population experienced, on average, 18 extreme heat alerts during this year’s Danger Season, counties with lower fractions of disadvantaged populations experienced 12 heat alerts. Counties with at least 25 percent disadvantaged populations and the highest numbers of heat alerts are in Arizona and California, as seen in the table below. Riverside County and Imperial County, both in California top the list with 84 and 77 heat alerts.

alerts during the 2024 Danger Season
Wildfires
Wildfires raged on as well this Danger Season. To give an idea, 404 wildfires—threatening 1.6 million acres—were active in the US as of October 21, 2024 according to American Forests. The Park Fire, affecting Tehama and Butte counties in northern California, started on July 24 (allegedly caused by an arsonist) and burned nearly half a million acres on days when there were already wildfire weather and heat alerts in these and adjacent counties.
The National Centers for Environmental Information tallies the number of fires and acreage burned; as of this writing, data are available to assess Danger Season impacts between May and August. These show a clear seasonal increasing trend in burned acres per fire, indicating that as peak wildfire season was reached in August, wildfires became more and more destructive.

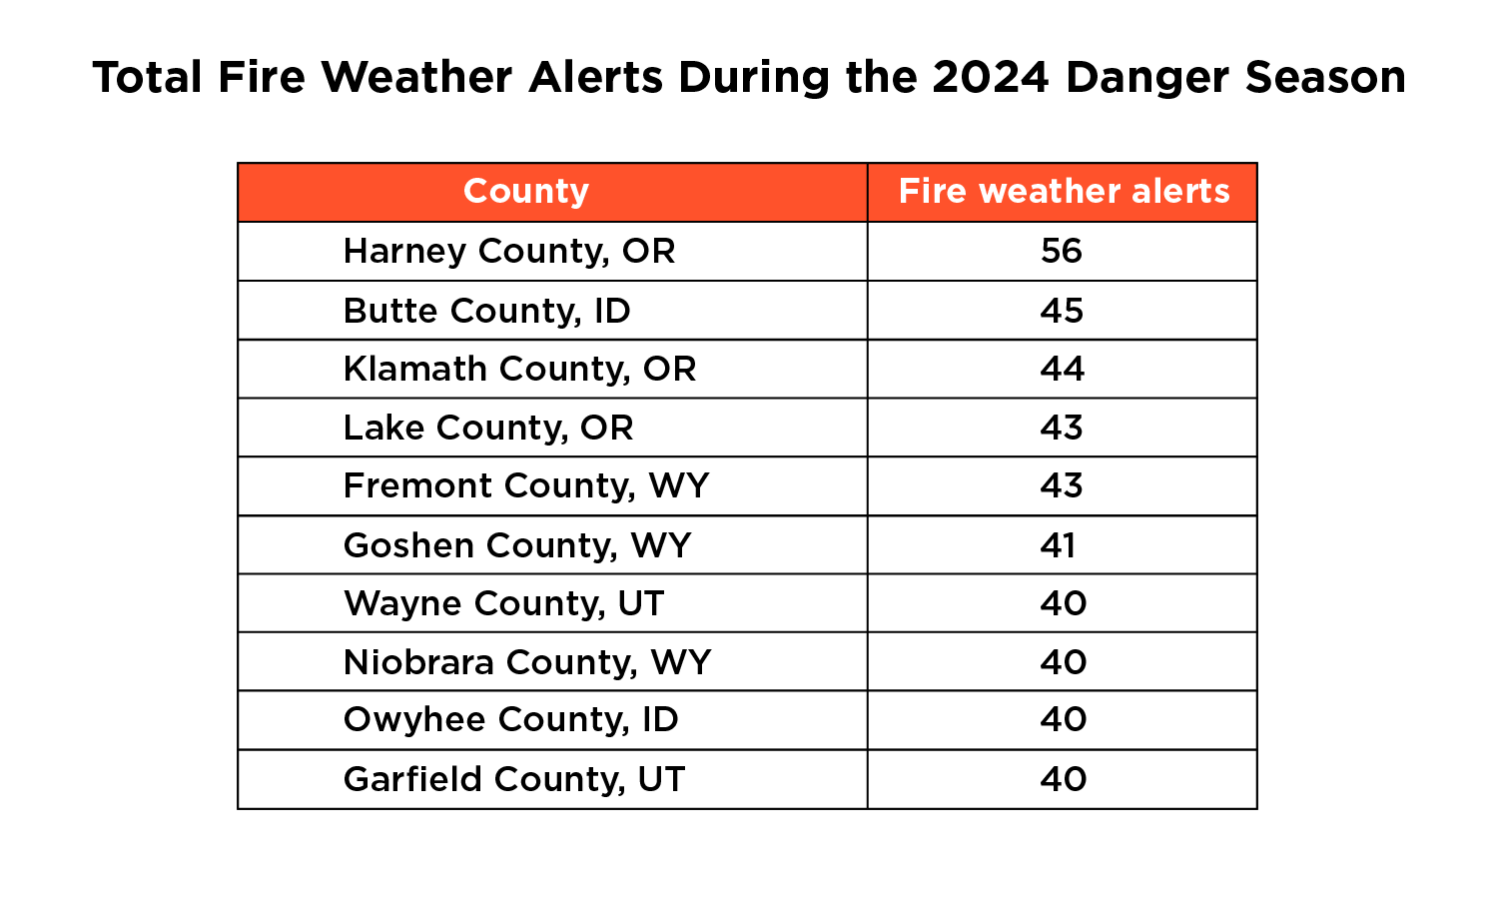
The top ten counties with at least 25 percent of their population at disadvantage and number of fire weather alerts in the 2024 Danger Season are in Oregon, Idaho, Wyoming, and Utah. Harney County, OR, tops the list with 56 fire weather alerts.

Flooding and Storms
Near-record warm ocean temperatures, a reduction in Atlantic trade winds and wind shear, and the development of La Niña in the Pacific led NOAA to issue an above-normal hurricane season forecast. And the forecast was accurate—17 named storms. Rapid intensification was the defining characteristic of hurricanes this Danger Season. The list is long, but here are some of the most impactful storms.
Beryl was a long-lived tropical cyclone (June 28 July 11), strengthening into a Category 5 over the Caribbean and making landfall not once, but twice over the Yucatán Peninsula before making landfall as a tropical storm about 100 miles southwest of Houston. Beryl was also the earliest-forming Category 5 storm on record, and poured 3-6 inches in southeast Texas and up to 2 inches in central and southern parts of Louisiana.
On August 13, Tropical Storm Ernesto rapidly intensified right before grazing Puerto Rico and the Virgin Islands. Although Ernesto did not make landfall in Puerto Rico or the nearby archipelagos, the storm still delivered winds reaching 50 miles per hour (mph, or 80.5 kilometers per hour) and heavy rainfall of up to 10 inches (25.5 cm) across Puerto Rico.
By the morning of Wednesday, August 14, around 728,000 customers—nearly half of the island—were left without electricity. Many communities also lost access to drinking water, as the water supply systems depend on electric pumps. Flood warnings were issued throughout the island due to the storm’s impact. This storm highlighted the fragile state of the badly-run energy infrastructure in Puerto Rico.
Hurricane Helene rapidly intensified from 45 to 80 mph (72.4 to 128.7 km/h), and it was blowing at 140 mph (225.3 kph) less than 36 hours later when it made landfall on September 26 as a Category 4 in the Florida Gulf Coast. In states such as North Carolina, the hurricane battered communities with high percentages of people living with disabilities, people of advanced age, or living in mobile homes, all markers of populations that face significant challenges to recover from such disasters.
And in perhaps the saddest and most sobering reminder that we are running out of places to be safe from climate impacts, the community of Asheville, NC, more than 500 miles from where Helene made landfall, suffered more than 100 deaths from mudslides and other disasters caused by the storm.
The ninth hurricane of the 2024 season in the Atlantic was Hurricane Milton, which rapidly intensified into a Category 5 on October 7. Milton resulted in at least 24 fatalities, and brought at least 19 tornadoes to Florida.
These storms and other precipitation activity across the country brought large numbers of flood alerts this Danger Season. The highest number of flood alerts were in counties in Texas, Louisiana, Florida, Illinois, and North Carolina. These counties have high percentages of people at socio-economic disadvantage. Orange County, TX, tops the list with 131 flood alerts this Danger Season. Newton County, Texas is in third place with 111 flood alerts, and 100% of its population is in disadvantaged status.

Accurate weather forecasts helped save lives from the destruction of Helene and Milton
The National Hurricane Center’s (NHC) initial forecast for Hurricane Milton predicted a landfall location just 12 miles from the spot where the storm actually came ashore four days later. This early forecast allowed millions of people to evacuate in advance of the hurricane, which undoubtedly contributed to reducing the loss of life from destructive winds and lethal storm surge.
We need sustained and increased resources for scientists at key federal agencies such as NOAA and its dependencies (NHC and NWS) to do their job of issuing accurate, timely forecasts of extreme weather events that can minimize the loss of life and property. But if Project 2025 comes to fruition as written, the second Trump administration would break up and downsize NOAA (pro tip for the incoming administration: don’t dismantle NOAA; it’s proven that its science saves lives and property from climate impacts. I just wrote about it here).
This year’s Danger Season showed us that the climate crisis is in full force and worsening, and we need action to reduce global emissions, adapt to the impacts we can’t avoid, and strengthen the country’s scientific capacity to forecast extreme weather events and protect people.
Editor’s note: Due to an editorial error, this blog post’s previous headline included the word frequency, which implied that all types of weather events listed have become more frequent. Though the global total number of hurricanes tends to remain similar from year to year, the proportion of major (category 3 or higher) hurricanes has increased.

