
There are moments when your own data stops you dead in your tracks. I had one of those moments a few months ago as we were preparing to release our When Rising Seas Hit Home report.
The results were so stark, the case for sound climate policy so clear that I can think of no better way, on the eve of the fifth anniversary of Hurricane Sandy’s devastating landfall, to convey where sea level rise could take us than by spoofing what was arguably the most powerful televised public service announcement of my youth.

One of the most powerful televised public service announcements of my youth inspired this post.
Is there anyone out there who still isn’t clear about what sea level rise does? OK. Last time.*
This was the extent of flooding from Hurricane Sandy on Long Island

This is the area that would flood twice monthly by 2100 due to sea level rise

This is the extent of flooding from Hurricane Sandy in northern New Jersey (left) vs. the area that would flood twice monthly by 2100 due to sea level rise (right)

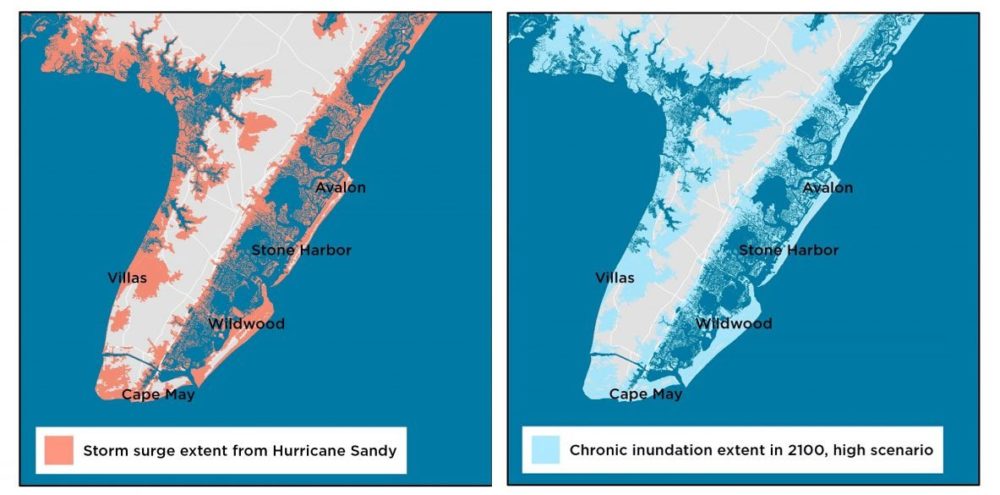
This is the extent of flooding from Hurricane Sandy in Cape May (left) vs. the area that would flood twice monthly by 2100 due to sea level rise (right)

*Yes, this was the actual language used in the PSA.
Data sources: UCS When Rising Seas Hit Home; FEMA Hurricane Sandy Impact Analysis; OpenStreetMap; Partnership for a Drug-Free America