
During the past several weeks, my phone weather alert has repeatedly shown Corvallis and Portland, Oregon, having fire and low humidity alerts. I did my postdoc there and remember the smell of burning woods during August and September. There have been record-setting wildfires this year in the Pacific Northwest and climate scientists argue that climate change is likely to make it worse due to increasing temperatures.
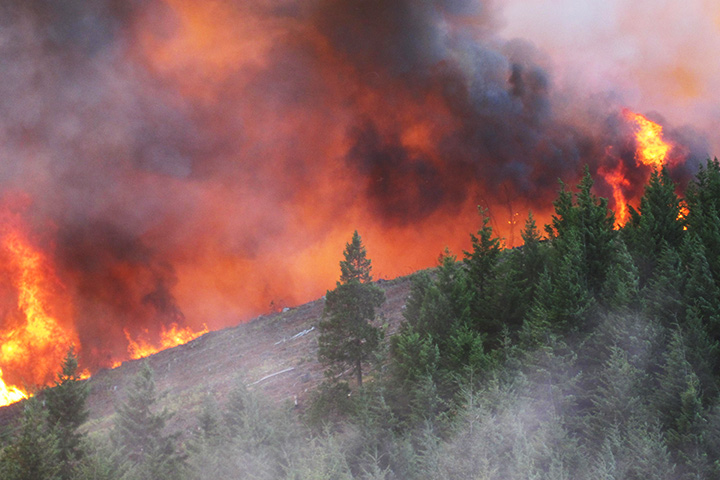
Oregon’s Douglas Complex fires on July 26, 2013. Photo: Marvin Vetter, Oregon Department of Forestry
In today’s changing climate, scientists are searching for ways to determine the cause behind the observed trends. The Pacific Northwest has experienced a statistically significant warming trend of 0.7°C (1.3°F) in annual mean temperature from 1901-2012, as indicated in a recent study by Abatzoglou and co-authors in the Journal of Climate. This trend has been attributed to heat-trapping emissions as the leading contributor to long-term warming.
This past week we saw a highly provocative alternative to Abatzoglou et al’s findings: the main cause of the century-long warming trends is due to natural changes in atmospheric circulation over the northeast Pacific, according to a new study by Johnstone and Mantua in the PNAS journal. The publication by Johnstone and Mantua has received a great deal of attention in the media, including an article in the New York Times. How could such a different conclusions be reached?

Most locations in the Pacific Northwest experienced a warming trend during the 20th century. Image: Climate Impacts Group, University of Washington.
The study by Johnstone and Mantua primarily used data from NOAA’s Extended Reconstructed Sea Surface Temperature (ERSST) and the National Atmospheric Research Center’s Monthly Northern Hemisphere Sea Level Pressure. Their rationale for their choice is that, prior to 1940, these two data sets most closely maintain a correlation seen after 1940. Thus, their analysis relies on a limited amount of information with which to base their conclusions. Indeed, further inspection of their supplementary material shows strong divergence between different sea level pressure data sets before 1940 (NOAA’s Ocean-Atmosphere data set, 20th Century Reanalysis, National Centers for Environmental Prediction-NCAR’s Reanalysis and the Hadley Center’s HadSLP2).
Another important factor in Johnstone and Mantua’s work is that their results are very much influenced by the period before 1940, whereas most of the anthropogenic warming has occurred after 1960. What might have their results looked like if they had focused on the 1940-2012 period? Would they have been closer to Abatzoglou et al’s study?
In Johnstone and Mantua’s study, the relationship between sea level pressure and air temperature is explored via a single linear regression between the two variables. This constrains the statistics of the results. On the other hand, Abatzoglou et al’s work uses multiple linear regression with factors such as El Niño-Southern Oscillation, natural atmospheric circulation patterns, volcanic activity, solar variability, and anthropogenic forcing (heat-trapping gas emissions). Their analysis suggests that natural factors alone fail to explain the observed warming.
The attribution research I have conducted also suggests that changes in extreme heat events in the Pacific Northwest are mostly due to increasing greenhouse gas concentrations. In preliminary work presented at the American Meteorological Society’s 2014 annual meeting, I showed that rare daily maximum temperature events (1 in 100 years) during the summer were twice as likely to occur in the 2000s compared to the 1960s, when heat-trapping gas concentrations were much lower than in the 2000s. I also tested for the influence of the ocean, where the La Niña pattern (cooler temperatures in the tropical Pacific) tends to favor warmer temperatures, and found that heat extremes during La Niña patterns were warmer in the 2000s.
Large parts of the Pacific and Indian Ocean temperatures were at their record warmest in August 2014. Image: NOAA
Johnstone and Mantua’s publication provides an interesting perspective on how the oceans can have a larger footprint than human-induced changes in the atmosphere. But humans can also influence the oceans. For example, recent studies have shown that the oceans have absorbed the majority of the heat related to human emissions. Thus, the key to understanding climate change is to explore the intricacies of how the waters of our planet tangle with the atmosphere and how humans can affect this interaction.