UPDATE February 2020: Driving the average EV is responsible for fewer global warming emissions than the average new gasoline car everywhere in the US. Read our latest analysis, “Are Electric Vehicles Really Better for the Climate? Yes. Here’s Why.”
As we embark on the 4th annual National Drive Electric Week, U.S. electric vehicle (EV) sales are approaching a quarter million, and 20 plug-in models are now available in at least some parts of the country. This represents a major advancement from the first introduction of the Chevy Volt and Nissan Leaf plug-in electric vehicles in model year 2011. It’s not just the number of models and sales numbers that have changed in the last four years. We’ve also seen the average energy efficiency of EVs improving. Just as making gasoline vehicles more efficient reduces fuel consumption and lowers emissions, making EVs that consume less electricity for every mile they drive is lowering the carbon footprint of driving on electricity. Based on improvements in EV efficiency and more recent electricity emissions data, 60 percent of American’s now live in regions where an EV produces fewer global warming emissions than even the most efficient gasoline-hybrid vehicle.
Upgrades and new models improve EV efficiency
Some plug-in electric models have undergone improvements to improve their efficiency. The Nissan Leaf, for example, was upgraded in model year 2013 with improved regenerative braking, aerodynamics, and a more efficient heater to boost the previous efficiency rating of .34 kWh/mile (a measure of how much electricity is consumed for traveling 1 mile) to the current model years rating of .30 kWh/mile – a 12% improvement (a lower kWh/mile rating = more efficient).

The Nissan LEAF efficiency rating improved by 12 percent between model year 2011 and model year 2013, lowering the amount of electricity needed per mile of driving. Photo courtesy of Nissan.
To put that in perspective, the amount of electricity you use to power your toaster oven for about 20 minutes can move a 3,000 pound electric car more than a mile. A flurry of new BEV (battery electric) models have also been introduced since 2011, including the Honda Fit, Chevy Spark, Ford Focus EV, Toyota RAV4 EV, Tesla Model S, the Smart ED, Chevy Spark EV, and most recently the BMW i3.
This post is part of a series on National Drive Electric Week.
These vehicles span a range of efficiency. Some of the larger and longer range EVs, like the Model S sedan and RAV 4 EV SUV, consume more energy than their smaller counterparts, similar to how larger gasoline vehicles typically have lower fuel efficiency than smaller cars. For example, the two variants of the Tesla Model S are rated at .35 kWh/mile and .38 kWh/mile, with the longer range, higher-powered version consuming more electrons per mile. In comparison, the RAV 4 EV, a compact SUV, is rated at .44 kWh/mile. But other models, like the Fiat 500e and the BMW i3, exceed even the Leaf in efficiency. The BMW i3 is currently the most efficient vehicle on the road – achieving an EPA rating of .27kWh/mile. This is in large part due to the weight savings of the carbon fiber structure unique to the i3 and from designing the model from the ground up as an EV.
Improving EV efficiency lowers the global warming emissions from EVs
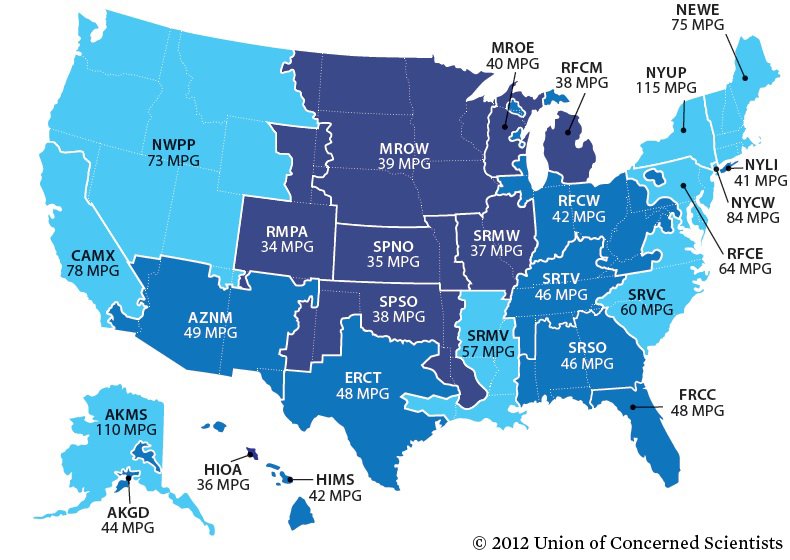
In our 2012 State of Charge analysis, we estimated the global warming emissions of operating an EV in different parts of the country. That analysis was based on the efficiency of the average BEV sold in 2011, equivalent to the model year 2011 Nissan Leaf (.34 kWh/mile). With new EV models and upgrades to older ones, the current average efficiency of new BEV’s is .325 kWh/mile (based on sales from July 2013 to June 2014) – representing about a 5% improvement since 2011. The combination of vehicle efficiency improvements and more recent power electricity emissions data directly translate to lower global warming emissions from driving an EV. Below is a map of the updated regional estimates for global warming emissions for the 26 electricity grid regions across the US. Compared to our previous analysis, nearly every region of the country has improved emissions for EVs. The improvements were enough to put the Texas, Florida and Southwest region into our “Best” category – where EV emissions are lower than a 50 mile per gallon gasoline-powered vehicle, and moved the northern plains states to the “Better” category.

60 percent of Americans now live in areas where driving an EV has lower global warming emissions than even the best hybrid, up from our estimate of 45% just 3 years ago.
And consistent with our initial study findings, no matter where you live in the U.S., an EV has lower global warming emissions than the average new compact car, which gets approximately 28 miles per gallon. Emission from EVs are poised for even further reductions, as national electricity data from 2011 and 2012 show a declining percentage of coal power while renewables like wind and solar are increasing. This more recent data is not yet reflected in EPA’s eGRID power plant database or reflected in the map above. With increasing renewable electricity coming onto the grid, carbon standards for power plants under development, and continued improvement in vehicle technologies, the benefits of EVs will continue to grow.

For comparison: previous estimates using 2009 power plant data and average battery electric EV efficiency for model year 2011.
Notes on calculations: The updated analysis is based on the original State of Charge report methodology including the following updates: 1) Power plant emissions data for calendar year 2010 – eGRID2010 data. Nationally, the average global warming emissions intensity (grams of CO2 equivalent per kWh of electricity delivered) for power produced in the US increased slightly between 2009 and 2010 by about 1%. Variations in regional emissions are larger due mainly to variations in nuclear and hydro electricity production compared to 2009. National net generation data from EIA indicates that the fraction of coal-fired power to overall generation was reduced during subsequent years (2011 and 2012), meaning emissions intensity has improved, but regional data developed through eGrid is not available for those years. 2) GREET 1 2013 for global warming emissions of petroleum as well as estimates for upstream electricity emissions. 3) Average EV efficiency of 32.5 kWh/mile based on sales of battery electric vehicles between July 2013 and June 2014. 4) Population estimates are based on 2010 census data.

