

Almost every week is bringing news about another step forward somewhere in the country for America’s newest renewable energy, offshore wind. Increasingly, the news is about advances for specific projects off our shores.
But when we hear about an offshore wind project of a certain size—X hundred megawatts—what does that mean? What does it mean in terms of our electricity needs, for example, or our need to cut pollution, or our potential to do more?
A simple new calculator from the Union of Concerned Scientists can help you size up each offshore wind project.
The inputs
Here’s the deal: When you hear about a proposed offshore wind farm, the project size is likely to be expressed in terms of megawatts—its nominal capacity/power output, based on the rating of each wind turbine at a given wind speed.

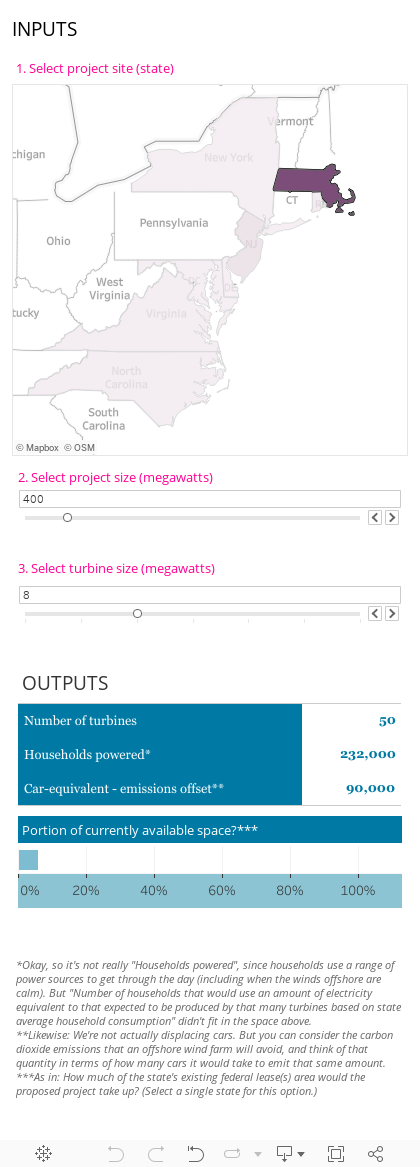
Credit: J. Rogers
How many turbines that proposed project will involve depends on the capacity of each individual turbine (also expressed in megawatts). That math isn’t complicated.
How much electricity an offshore wind project’ll generate is a little more complicated, depending mostly on where the turbines will be—what kind of wind resource the turbines will have access to. That’ll vary by state, and even within a given coastal area.
But with a few simplifying assumptions and estimates, you can get ballpark figures for what the project will mean in terms of the energy generation/production, the benefits it will provide such as avoided carbon emissions, and the area it will occupy.
The outputs
What the new tool offers when you put in those few inputs (state, project size, turbine size) can tell you something about what we’re likely to get out of the project you’re assessing.
Energy equivalent – The electricity expected from a project can be thought of in terms of the number of household equivalents it could power. Not actual households, since it takes a mix to make sure we’ve got power ‘round the clock, but how the energy produced matches up with the amount of electricity a typical household uses.
Average household electricity use varies by region and state, based on things like the climate and state energy efficiency efforts. So a given amount will go further in some places than in others.
Pollution reduction – And then there are the air quality benefits of projects. Megawatt-hours of offshore wind generation will displace megawatt-hours of generation from land-based power plants in the region. What an offshore wind electron displaces depends on what’s “on the margin” at a given moment—usually what next-cheapest power source doesn’t get turned on because offshore wind is doing its thing instead.
If those displaced sources are coal, oil, or natural gas power plants, which will often be the case, the offshore wind power will help us avoid the pollution that those plants would otherwise emit. Avoiding that pollution brings important health and environmental benefits.
This simple calculator focuses on carbon dioxide. And it puts the result in terms of number of car equivalents—what that CO2 pollution reduction would be like in terms of the carbon pollution that comes from a typical car in a typical year, given the US auto fleet and American driving habits.

Leases and lessees – some done, more to come (Source: BOEM 2018)
Lease area potential – In general, the areas most ready for offshore wind projects are in the existing federal leases on the US Outer Continental Shelf off our nation’s East Coast. The federal government, using robust public stakeholder processes (as in Massachusetts), identified various offshore wind lease areas. It auctioned off the leases, and a range of companies won the rights to put up turbines in those areas. There are more than a dozen such leases so far, from North Carolina up to Massachusetts. (And more are on the way.)
Given that, you can think about a project in terms of how much of that state’s existing lease area it’s likely to take up, and how much room it leaves for more offshore wind power.
Using the calculator
To ground all this in (projected) reality, here’s an example for you to try: Let’s imagine a 400 megawatt wind farm off Massachusetts (and at this point in the process that doesn’t require much imagination), and imagine 8-megawatt wind turbines. So:
- Click on Massachusetts on the calculator’s map.
- Use the sliders or right-left arrows to get to 400 megawatts for the project size.
- Pick 8 megawatts for the turbine size.
- Check out the results.
- For number of turbines, you get 50.
- For number of households whose total energy consumption would match what the project would produce, you’d get something like 230,000.
- The avoided CO2 pollution would be equivalent to taking some 90,000 cars off the road.
- Check out how much—or how little—of the existing Massachusetts lease areas a project like that would use up: 6%.
At the bottom of this post are details about the calculator and calculations.

The scale of things to come: Offshore wind blades, and a sample of the people behind it all (Credit: Derrick Z. Jackson).
More results
Other results from new offshore wind are equally important, but harder to quantify simply at this early stage in the technology’s history in this country. Those include employment and ecosystem effects.
Jobs – A big reason for offshore wind power’s popularity right now is its tremendous potential for job creation, in manufacturing, project development, installation, maintenance, finance. Think welders, pipefitters, electricians, boat crews, and a whole lot more.
And the vision is not just jobs, but careers, as single projects pave the way for multiple tranches that then lead to a whole US offshore wind industry, one big enough to sustain not just projects but all the soup-to-nuts pieces that go along with that when the scale is big enough.
In Europe, the offshore wind industry is 75,000 workers strong. Estimates for US jobs draw on assumptions about how big the American market will get, and how quickly, and what that means for how many of the jobs end up here, instead of overseas. A 2015 US Department of Energy study found that going to 22,000 megawatts by 2030 could mean 80,000 American jobs by that year. A study for various Northeastern states looked at 4,000 to 8,000 megawatts of offshore wind development in the region, and projected full-time equivalent jobs in a given year of up to 36,000.

Proceed, but with caution (Credit: Derrick Z. Jackson).
Ecosystems – The results of an offshore wind farm in terms of our offshore ecosystems depend on the care taken in planning, siting, installing, operating—and, eventually, decommissioning—of the project. Offshore wind’s potential to cut carbon pollution can help reduce the impacts of climate change—including important ones for our oceans and marine ecosystems. But additional activity and infrastructure in the marine environment can have direct impacts that need careful consideration.
One concern is marine mammals, and particularly, on the Eastern seaboard, the critically endangered North Atlantic right whale. Project developers have to be careful to not add to the right whale’s troubles.
For fish, once a project is in place, the bases for the offshore wind towers can be problematic for some species, and a boon for others, as they can act as artificial reefs and change the environment.
Where jobs and fish come together is in the fishing fleet. Results, positive and negative, will depend on things like any limitations on boat travel in the project area during construction, and any boost to fish stocks from the project once it’s installed. While commercial fishers may view projects differently from how recreational ones do, at least some fishers are finding the US’s first offshore wind farm, off Rhode Island’s Block Island, to be a plus (and there’s this upbeat from the University of Delaware and the American Wind Energy Association).
Results in terms of jobs, careers, and our marine environment will be important to keep an eye on.

Technology and people (Credit: Derrick Z. Jackson)
Calculate on
In the meantime, there’s plenty we can know about with greater certainty. With the help of this simple calculator, the next time you hear of an X megawatt offshore wind project destined for a shore near you, you can let it be more than a single number. Look at what it means in terms of energy to be generated, pollution to be avoided, and lease area implicated.
To be clear: an offshore wind calculator is no substitute for the detailed wind monitoring, engineering calcs, environmental assessments, and much more that go into project proposals, investment decisions, and approval processes.
But this one just might help give some more depth for contemplating project announcements as the offshore wind industry takes off in the country. Because, beautiful as offshore wind farms seem to many of us, they’re a lot more than just a bunch of graceful kinetic sculptures.
The technical stuff
- States – The calculator includes the eight (as of this writing) states for which the US government’s Bureau of Ocean Energy Management (BOEM) has auctioned off leases. South Carolina is working toward joining that club. Projects can also happen in state waters, as with the Icebreaker project planned for Lake Erie waters off Cleveland. The West Coast also has terrific resources, and even the Gulf Coast may get into the act at some point.

The power on the seas (Source: NREL/Musial et al. 2016)
- Capacity factors – To calculate electricity production, the calculator uses midpoint capacity factors from the different zones in NREL’s latest offshore wind resource potential assessment (Musial et al. 2016): Delaware (42.5%), Maryland (42.5%), Massachusetts (47.5%), New Jersey (45%), New York (45%), North Carolina (42.5%), Rhode Island (47.5%), and Virginia (42.5%).
- Household equivalents – The calculator uses the latest figures from the US Energy Information Administration on average monthly electricity use by residential customers in the chosen state. Figures are rounded to the nearest thousand.
- Avoided CO2 emissions – The calculator uses the average CO2 emission rate for each region, as calculated by the US EPA, and the car pollution figure from EPA’s own equivalencies calculator. Figures are rounded to the nearest thousand.
- Project areas – Project footprint calculations are based on NREL’s assumption of 3 megawatts per square kilometer (Musial et al. 2016).
- Lease areas – The lease area calculations for each state are based on the figures from BOEM here. For the two leases in the shared Rhode Island/Massachusetts offshore wind area, the calculator credits those amounts fully to each state; that is, it considers them to be Rhode Island’s when considering a Rhode Island project, and Massachusetts’s when looking at Massachusetts.