
A curious thing happened in the aftermath of President Trump attempting to sign away the past eight years of work on climate and clean energy: the public face of progress didn’t flinch. From north to south and east to west, utilities and businesses and states and cities swore their decarbonization compasses were unswerving; yes, they said, we’re still closing coal plants, and yes, yes!, we’re still building ever more wind and solar—it just makes sense.
But here’s why all the subsequent commentary reiterating the inevitability of coal’s decline and cheering the unsinkable strength of renewables’ rise was right in facts, but incomplete in message:
Coal is closing. Renewables are rising. But right now, we need to be talking about natural gas.
We’re fine without a map…
President Trump accompanied his signature on the Executive Order on Energy Independence with a vow that the order would put the coal industry “back to work.” But shortly thereafter, even those in the business reported they weren’t banking on a turn-around. Coal plants just keep shutting down:

This map shows coal units that have retired just between 2007 and 2016—many more have been announced for closure in the near future.
At the same time, renewable resources have been absolutely blowing the wheels off expectations and projections, with costs plummeting and deployment surging. The renewable energy transformation is just that—a power sector transformation—and it certainly appears there’s no going back:

Wind and solar capacity has been growing rapidly since the early 2000s.
Now when you put these two trajectories together, you end up with an electric power sector that has, in recent years, steadily reduced its carbon dioxide emissions:

Three positive charts, and three tremendous reasons to cheer (which we do a lot, and won’t soon stop—clean energy momentum is real and it’s rolling). The problem is, these charts only capture part of the energy sector story.
What’s missing? Natural gas. Or, what is now the largest—and still growing—source of carbon emissions in the energy sector.
…Until we finally realize we’re lost
There are two phases to climate change emissions reductions conversations. In Phase 1, we acknowledge that a problem exists, we recognize we’re a big reason for that problem, and we take action to initiate change. With the exception of just a few of the most powerful people in our government (oh…them), we seem to have Phase 1 pretty well in hand. Cue the stories about the triumphant resilience of our climate resolve.
The trouble is Phase 2.
In Phase 2, we move to specifics. Namely, specifics about what the waypoints are, and by when we need to reach them. This is the conversation that produces glum replies—and it’s the source of those weighty, distraught affairs scattered among the buoyant takes on the recent executive order—because the truth is:
- We know what the waypoints are,
- We know by when we need to reach them, and
- We know that currently, we’re not on track.
Without a map, we’re left feeling good about the (real and true) broad-brush successes of our trajectory—emissions reductions from the retirement of coal plants; technology and economic improvements accelerating the deployment of renewables—but we have no means by which to measure the adequacy of our decarbonization timeline.
As a result, we put ourselves at grave risk of failing to catch the insufficiency of any path we’re on. And right now? That risk has the potential to become reality as our nation, propelled by the anti-regulatory, pro-fossil policies of the Trump administration, lurches toward a wholesale capitulation to natural gas.
Natural gas and climate change
Last year, carbon dioxide emissions from coal-fired power plants fell 8.6 percent. But take a look at the right-hand panel in the graph below. See what’s not going down? Emissions from natural gas. In fact, carbon dioxide emissions from natural gas overtook coal emissions last year, even omitting the additional climate impacts from methane released during natural gas production and distribution.
Bridge fuel? Not so much.

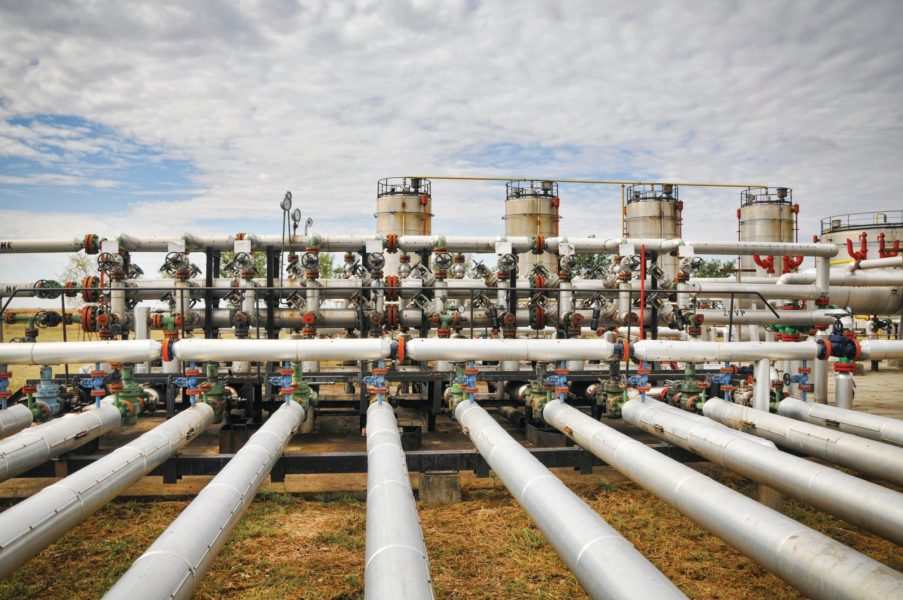
There’s no sign of the trend stopping, either. Natural gas plants have been popping up all across the country, and new plants keep getting proposed—natural gas generators now comprise more than 40 percent of all electric generating capacity in the US.

Natural gas plants are located all across the country, and new projects keep getting proposed.
And all those natural gas plants mean even more gas pipelines. According to project tracking by S&P Global Market Intelligence, an additional 70 million Dth/d of gas pipeline capacity has been proposed to come online by the early 2020s (subscription). That is a lot of gas, and would require the commitment of a lot of investment dollars.
When plants are built, pipelines are laid, and dollars are committed, it becomes incredibly hard to convince regulators to force utilities to let it all go.
Still, that’s what the markets—and the climate—will demand. As a result, ratepayers may be on the hook for generators’ bad bets.
The thing is, we know today the external costs of these investments, and the tremendous risks of our growing overreliance on natural gas. So why do these assets keep getting built?
Because many of our regulators, utilities, and investors are working without a map.
Now there are a growing number of states stepping up where the federal government has faltered, and beginning to make thoughtful energy decisions based on specific visions of long-term decarbonization goals, like in California, the RGGI states, and as recently as this week, Virginia. Further, an increasing number of insightful and rigorous theoretical maps are being developed, like the US Mid-Century Strategy for Deep Decarbonization, amongst many others (UCS included).
But for the vast majority of the country, the main maps upon which decarbonization pathways were beginning to be based—the Clean Power Plan and the Paris Climate Agreement—are both at immediate risk of losing their status as guiding lights here in the US, sitting as they are beneath the looming specter of the Trump administration’s war on facts.
Plotting a course to a better tomorrow
So where to from here? Ultimately, there is far too much at stake for us to simply hope we’re heading down the right path. Instead, we need to be charting our course to the future based on all of the relevant information, not just some of it.
To start, we recommend policies that include:
- Moving forward with implementation of the Clean Power Plan, a strong and scientifically rigorous federal carbon standard for power plants.
- Developing, supporting, and strengthening state and federal clean energy policies, including renewable electricity standards, energy efficiency standards, carbon pricing programs, and investment in the research, development, and deployment of clean energy technologies.
- Defending and maintaining regulations for fugitive methane emissions, and mitigating the potential public health and safety risks associated with natural gas production and distribution.
- Improving grid operation and resource planning such that the full value and contributions of renewable resources, energy efficiency, and demand management are recognized, facilitated, and supported.
We need to show that where we’re currently heading isn’t where we want to be.
We need to talk about natural gas.
Correction, Friday June 2nd, 2017: Natural gas is now the largest source of carbon emissions in the energy sector overall, not the electric power sector as previously stated.