
After a summer featuring heat wave after heat wave that left almost no part of the United States untouched by extreme heat, this week’s transition to fall brings with it the hope that the hottest days of Danger Season are behind us until next year. Climate change is amplifying the climate-related threats we have typically experienced during the summer, such as heat waves and hurricanes, which is why we have renamed summer “Danger Season.”
Hurricanes and wildfires remain threats and realities that will extend into the fall—as I write this, the entire island Puerto Rico is without power due to Hurricane Fiona and communities around California’s still-burning Mosquito Fire are under a flash flood watch because rain falling on newly burned land can trigger mudslides. But with the hottest part of Danger Season over, what can we conclude about extreme heat in the United States over the last few months? Was 2022 exceptional? Here are four takeaways and nine maps to illustrate Danger Season’s heat this year.
This was one hot summer for most of the United States.
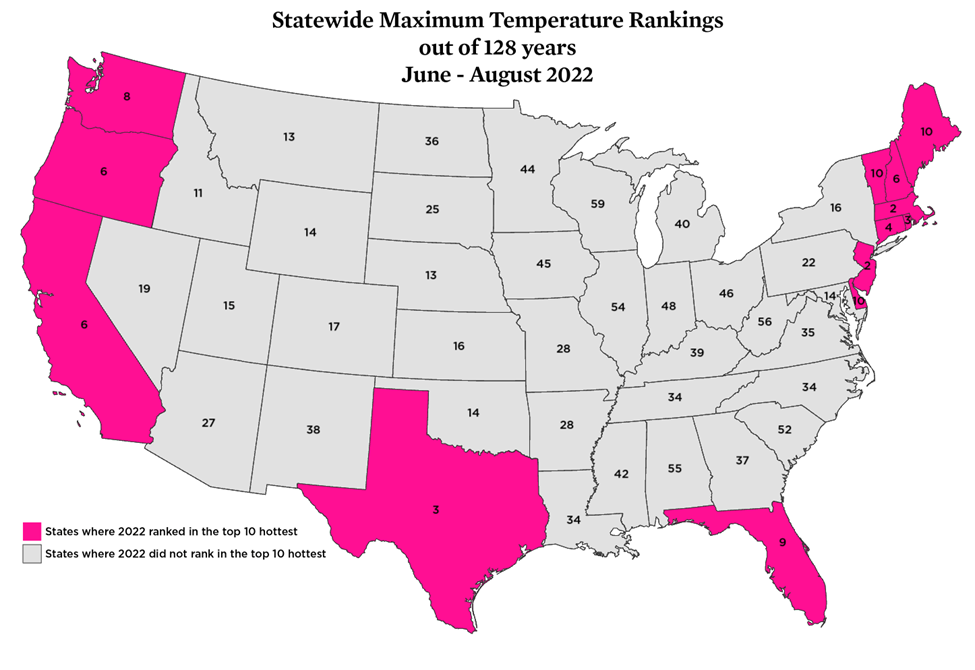
Nationally, NOAA has ranked this year’s summer from June–August as the third hottest on record. So yes, on average, this was a hotter summer than most. NOAA also evaluated 128 years of observational data for each state, then ranked each state to see how conditions this year stacked up against other years.
If we look state-by-state at daily maximum temperatures—which can be thought of as daytime highs—a couple things stand out: In 13 states, 2022 was one of the top 10 hottest years on record for daily maximum temperatures. For Connecticut, Massachusetts, New Jersey, Rhode Island, and Texas this summer ranked in the top five in terms of hot daytime temperatures.
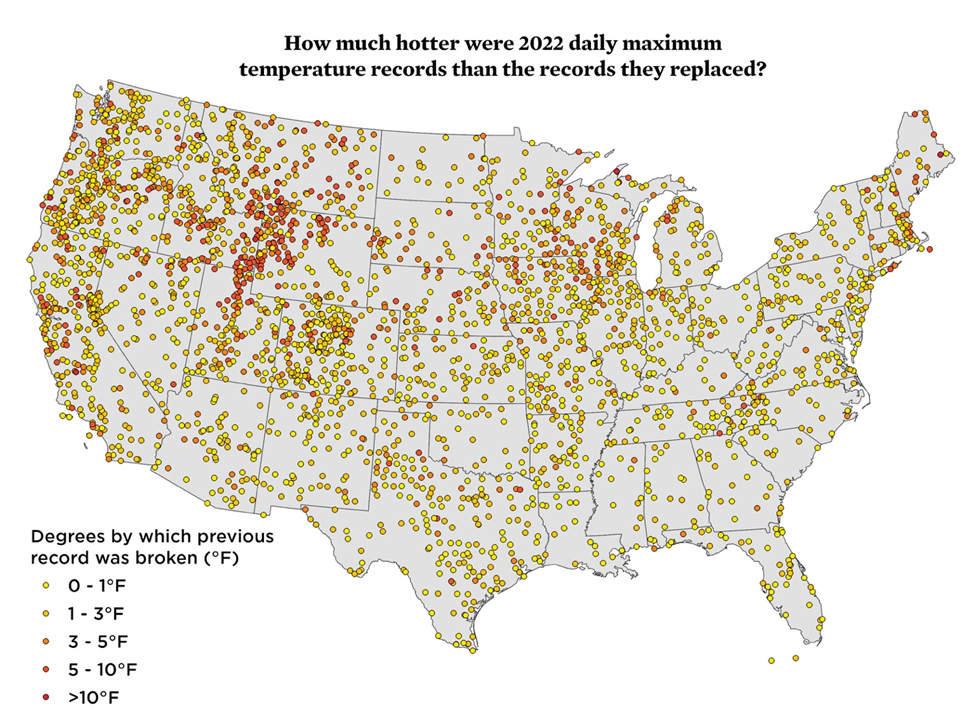
Between May and mid-September, nearly 10,000 daily maximum temperature records were broken. That’s similar to the number of records broken over the past five summers, but it’s interesting to see that many of this year’s records—particularly in the Mountain West—shattered previous records by 5°F or more. Cottonwood Creek, Wyoming, for example crushed its previous daily high temperature record by 9°F on August 6, 2022. When was the previous record set? Just last year.
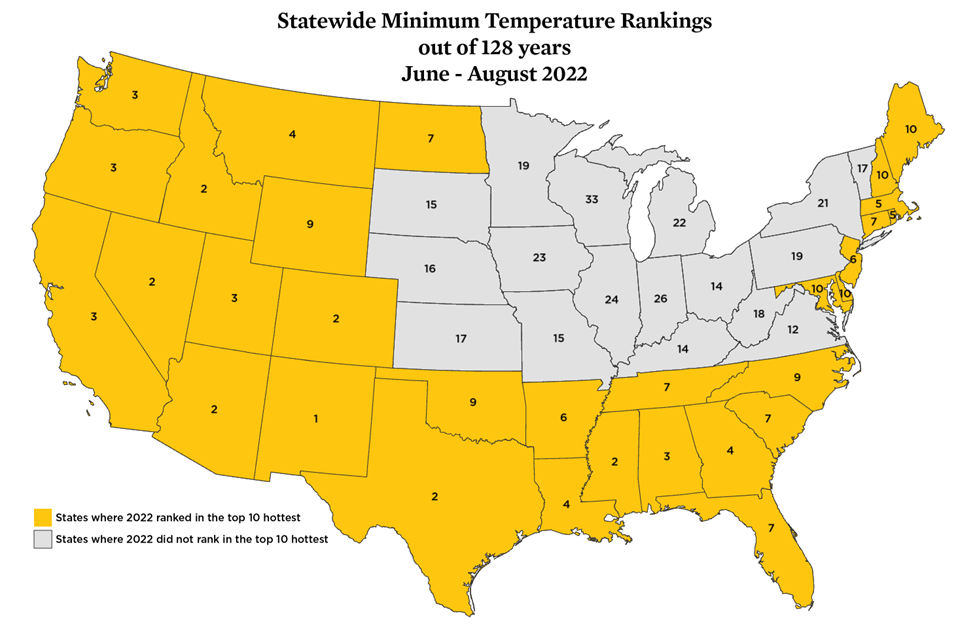
Our nighttime temperatures this Danger Season were even more notable. In 31 states (that’s nearly two-thirds of the states in the contiguous US!), 2022 was one of the top 10 hottest years on record for daily minimum temperatures (or nighttime lows). The western US in particular experienced exceptionally hot nights, with New Mexico’s summer nights averaging out to be the hottest on record.
Climate change made hot temperatures more likely this summer
This summer, our colleagues at Climate Central launched the Climate Shift Index, or CSI. For every day’s temperature forecast, the CSI measures how much more likely a given location’s temperatures are because of climate change. A CSI of 2, for example, indicates that temperatures were twice as likely because of climate change, a CSI of 5 indicates they were five times as likely.
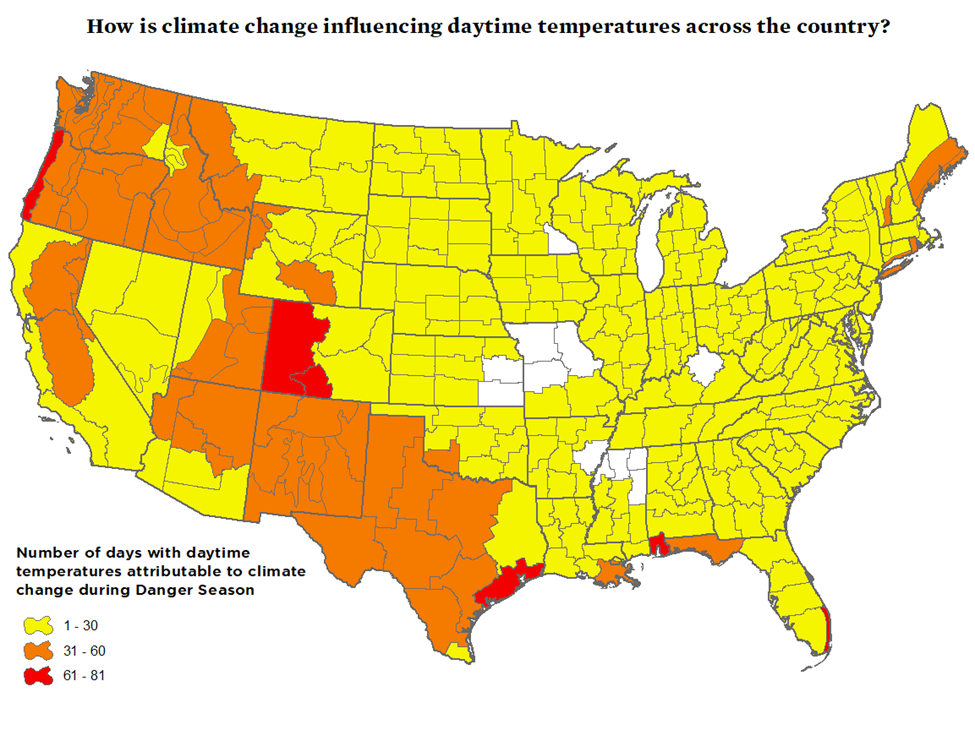
We looked back at the CSI data for every day from May 1 through September 16 for every climate division in the US. Climate divisions delineate parts of states where the climate is relatively homogenous. California’s temperate Central Coast, for example, is a distinct climate division from the state’s hotter, drier Central Valley. Nearly every climate division in the contiguous US experienced daytime high temperatures that were made more likely because of climate change. Seventy-four climate divisions—located mostly in the western half of the country and along the Gulf Coast—experienced 31 or more days this summer when climate change made hot conditions more likely.
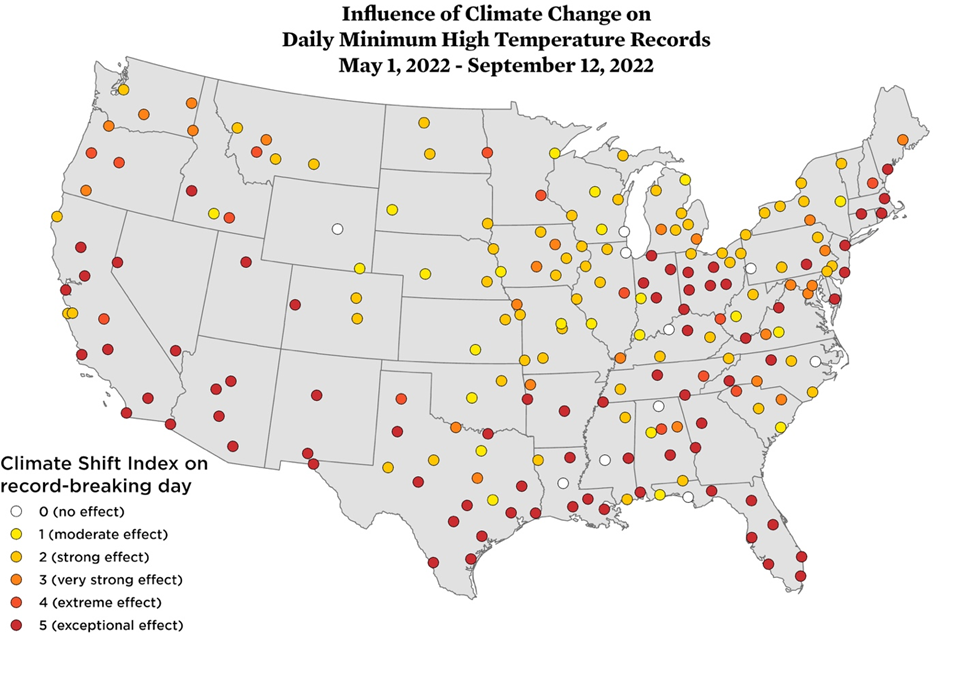
When daily temperature records were broken this summer, more often than not climate change was playing a role. To determine this, we looked for weather stations that set daily records that were also evaluated using the CSI. (The CSI is only evaluated at a subset of all the weather stations available in the US.)
For the locations where CSI data was available, 65% of the daily maximum temperature records featured temperatures made more likely by climate change.

Again, the fingerprints of climate change are even more apparent for nighttime temperatures. Every single climate division in the contiguous US experienced warm nighttime temperatures made more likely because of climate change. A staggering 225 climate divisions (65% of the total) experienced 30 or more nights when warm temperatures were made more likely because of climate change. For 27 climate divisions, the signal of climate change was apparent for 121 or more nights. That’s nearly every night since the start of May. The fact that these nighttime signals are stronger than the daytime signals is actually a hallmark of climate change and something I wrote about earlier this year.

Looking again at the CSI data, we can see that climate change made high temperatures more likely for 95% of the daily minimum high temperature records where CSI data were available.
Dangerous heat was more frequent in communities with higher social vulnerability
Throughout Danger Season this year, we have been monitoring heat-related alerts issued by the National Weather Service. We’ve tallied up the number of alerts each county experienced this summer and compared the total to the Centers for Disease Control and Prevention (CDC) Social Vulnerability Index (SVI) for that county. The SVI incorporates a number of socioeconomic and sociodemographic measures, including race, ethnicity, poverty, and education levels.
What we found is that more than 80% of the counties with the most frequent heat alerts—21 or more days of heat alerts over the course of the summer—have moderate to high levels of social vulnerability.

Even among counties with less frequent heat alerts—10 or more days of alerts this season—more than half (58%) had moderate to high social vulnerability scores.

As my colleagues and I have written about extensively in the past, extreme heat takes a particularly high toll on people with low incomes and people of color, particularly those living within urban heat islands. These maps combining extreme heat frequency and social vulnerability often reflect historical and ongoing environmental racism: many of these hot places have relatively high social vulnerability because they have been less desirable places to live, or simply the only affordable places to live, for groups that have long been marginalized. This includes places like the Central Valley of California, northern Louisiana, and much of Mississippi.
Extreme heat has plagued the Northern Hemisphere this Danger Season
It wasn’t just hot in the United States this summer, of course. Locations throughout the Northern Hemisphere experienced record-breaking temperatures this Danger Season, and in some instances, there have already been studies definitively linking extreme heat to climate change. While Pakistan has more recently been coping with extreme rainfall and utterly devastating flooding, it and neighboring India also experienced weeks of nonstop heat in April and May. In both India and Pakistan, temperatures hit 122°F weeks before the summer solstice, causing the season’s crop yields to decline and costing dozens of people their lives. Human-caused climate change was found to have made the heat wave 30 times more likely.
In mid-July, the United Kingdom reached an all-time high of over 104°F. Here, human-caused climate change was found to have made the two-day heat wave 10 times more likely. Heat waves in Spain and Portugal this summer were responsible for more than 2,000 deaths while extreme heat exacerbated drought and wildfires in France, Germany, and other EU countries. China endured a weeks-long heatwave just last month—it’s worst in roughly 60 years—during which rivers and waterfalls dried up, crops withered, and people succumbed to heat stroke. Around the globe, from China to Iran to Tunisia to Mexico, people have had to cope with excruciatingly hot conditions this Danger Season.
Extreme heat has taken a toll on the health and lives of people in the US and around the world over the last few months. While we have a long way to go before our communities are truly resilient to extreme heat, there have been notable signs of progress over the last few months. Oregon passed statewide heat-protection standards for outdoor workers, for example, and Washington state is in the process of strengthening its similar standards. And there’s growing awareness that we must start tracking heat-related illnesses and deaths nationwide. A combination of deep cuts to global heat-trapping emissions and a suite of policies to help people and communities stay safe when the temperature rises—policies like the Asuncion Valdivia Heat Illness and Prevention Act—would go a long way to reducing extreme-heat risks during future Danger Seasons.